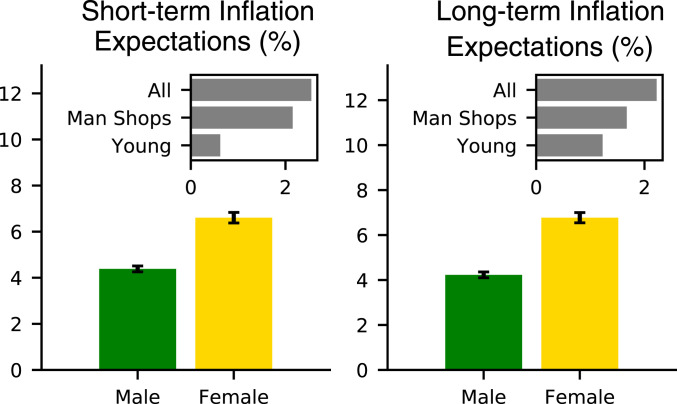
Fig. 6.
Gender gap in inflation expectations: replication in the New York Fed Survey of Consumer Expectations. The vertical bars report the estimated mean for men (green, left bar) and women (yellow, right bar) of short-run and long-run inflation expectations elicited by the New York Fed Survey of Consumer Expectations (41). Black segments are 95% confidence intervals. Gray horizontal bars indicate the difference between the expectations of women and men for three groups: “All” includes the full sample; “man shops” includes only respondents in the top 25% of US states based on the share of men who are the main grocery shopper in the household, which we compute in the Chicago Booth Expectations and Attitudes Survey; “young” includes only respondents below 25 y of age; the two latter subsamples capture groups in which gender norms might be less stark than in the full sample.

