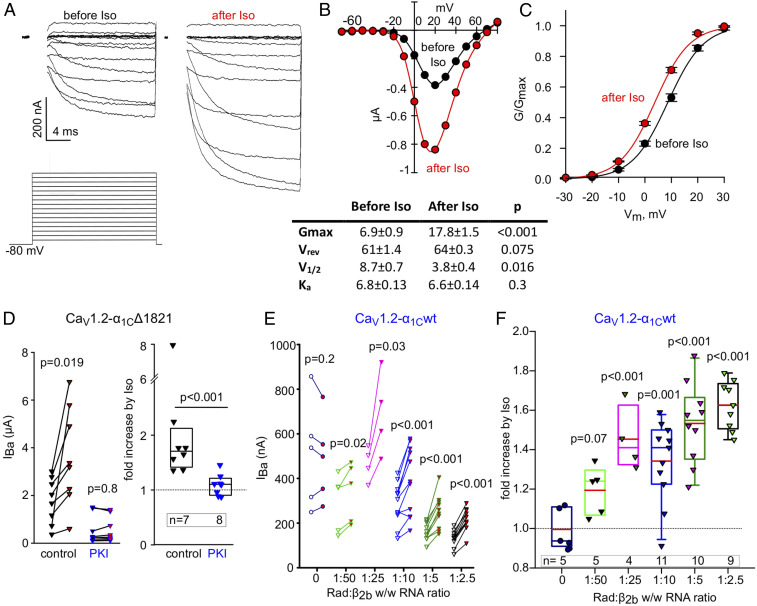
Fig. 3.
Full reconstitution of the β1-AR regulation of CaV1.2. (A–C) β1-AR regulation of voltage-dependent activation of CaV1.2. Oocytes were injected with RNA of α1CΔ1821, α2δ, β2b, Rad, and β1-AR. (A) Ba2+ currents (Upper) before (Left) and after (Right) perfusion of 50 µM isoproterenol (Iso) in a representative cell. The voltage protocol is illustrated in the Lower panel; IBa was elicited by 20 ms voltage steps given every 10 s from a holding potential of −80 mV in 10 mV increments. The currents shown are net IBa derived by subtraction of the residual currents recorded with the same protocols after applying 200 µM Cd2+. Since full capacity, compensation in oocytes was not achievable, and the currents during the first ∼2 ms (the duration of capacity transient) were blanked out. (B, Top) I–V curve before (black) and after (red) addition of Iso in the oocyte shown in A. (Bottom) Parameters of Boltzmann fit of I–V curves in seven oocytes, before and after Iso. (C) Conductance–voltage (G–V) curves of CaV1.2-α1CΔ1821 coexpressed with Rad and β1-AR averaged from oocytes of a representative batch (n = 7 oocytes, one experiment) before and after Iso. The curves were drawn using the Boltzmann equation using average V1/2 and Ka obtained from the fits of I–V curves in individual oocytes (from the table shown in B, Bottom). (D) PKI protein blocks the Iso-induced increase in IBa. Cells expressed α1CΔ1821, α2δ, β2b, Rad, and β1-AR. Purified PKI protein (29) was injected to a final concentration of ∼2 µM assuming oocyte volume of 1 µL, 0.5 to 2 h before measuring the currents. Control, no PKI preinjection. (Left) Before–after plots; statistics: paired t test. (Right) Summary of data from one experiment (Mann–Whitney U Rank Sum Test). (E and F) β1-AR regulation of CaV1.2-α1Cwt with increasing doses of Rad RNA. α2δ, β2b, and β1AR were coexpressed in all groups. (E) Before–after plots of Iso-induced changes in IBa, at increasing doses of Rad RNA. One experiment; statistics: paired t test. (F) Fold change increase in IBa caused by Iso as a function of Rad:β2b RNA ratio. Summary of the experiment shown in E. Statistics: one-way ANOVA, F = 11.8, P < 0.001.

