Fig. 1.
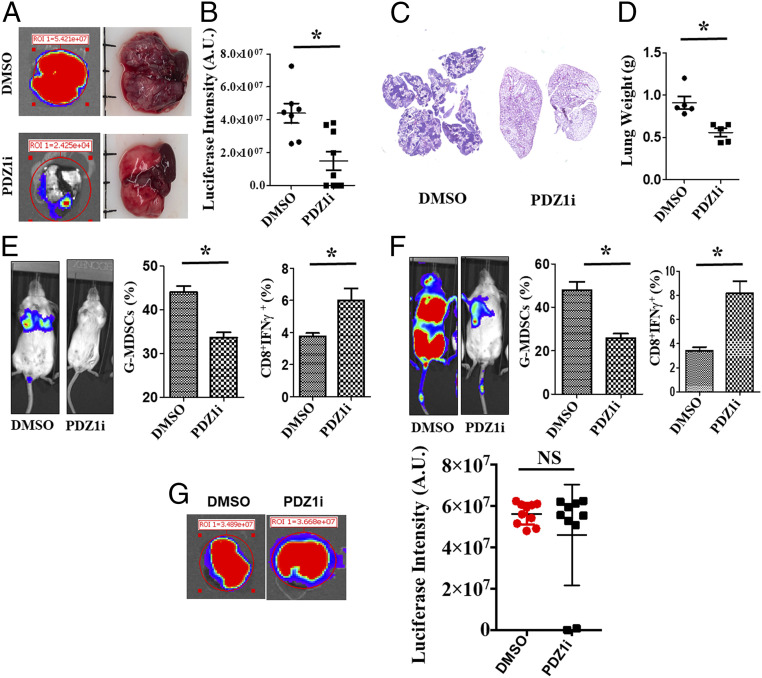
PDZ1i inhibits breast cancer experimental lung metastasis in immunocompetent animals. (A) A cohort (n = 16) of animals were inoculated with 4T1-Luc cells through tail vein injections. After 12 h, mice received DMSO or PDZ1i at a dose of 30 mg/kg body weight intraperitoneally on alternate days during a 2-wk study period (three injections per week and six injections in total). Representative ex vivo bioluminescence (BLI) images (Left), as well as photographs of lungs are presented from DMSO- and PDZ1i-treated groups (Right). (B) Relative luciferase intensity was measured in individual animals at a single time point (day 15) and was plotted. (C) Lungs were processed for pathological evaluation. Representative H&E sections at lower magnification are presented. (D) The gross lung weight (at the end of the study) was determined and was plotted. (E and F) A cohort of animals were inoculated with 4T1-Luc cells and separated into control (DMSO) and therapeutic (PDZ1i, 30 mg/kg body weight) groups. A subset of animals (n = 5) were killed on day 7 (after three doses of PDZ1i) and lungs were analyzed for accumulation of MDSC populations using FACS. Spleens were collected and total splenocytes were stimulated with 4T1-Luc cell extracts. CD8+IFN-γ+ cells were analyzed through FACS. Similar experiments were also performed on other subsets of animals on day 15. In both E and F, the Left shows BLI images of representative animals from each group. Center and Right represent the average of G-MDSCs and CD8+IFN-γ+ in the corresponding groups. (G) A cohort of NSG mice were inoculated with 4T1-Luc cells by intravenous tail vein injections. Mice received DMSO or PDZ1i injections 12 h later at a dose of 30 mg/kg body weight and then received a similar dose of test agent intravenously every alternate day for 2 wk (three injections per week and six injections in total). Representative BLI images (Left) and relative luciferase intensity (Right) was measured and plotted graphically. NS: Not statistically significant. *P < 0.05 is considered as statistically significant.

