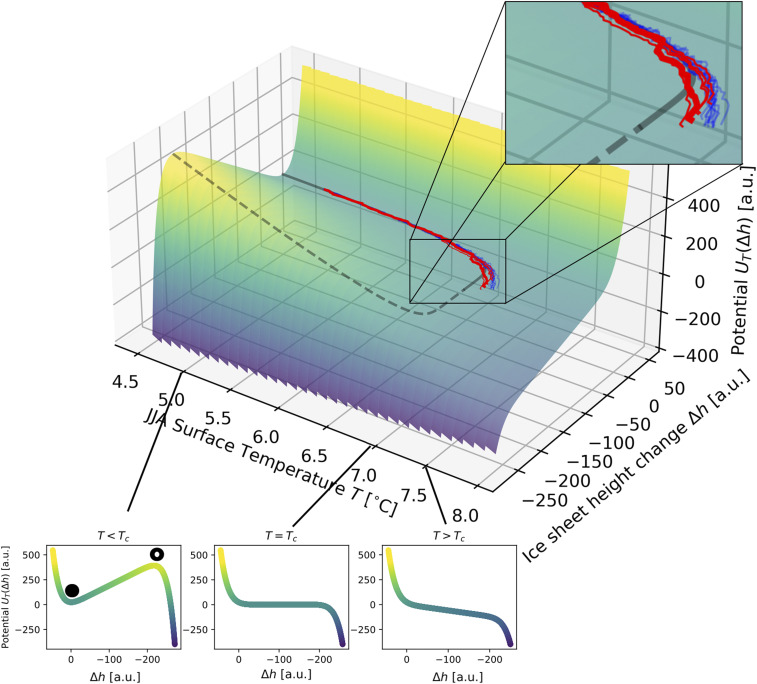
Fig. 2.
Potential landscape corresponding to Eq. 1. CWG ice sheet height changes derived from the measured melt rates (18) (see Materials and Methods) are shown in bold red curves, corresponding process-based simulations using regional climate models (18) are shown in thin red curves, and simulations according to the model described by Eq. 1 are shown in thin blue curves (see the upper inset for a zoomed-in version). Note the high similarity between the reconstructions, process-based simulations, and the conceptual model simulations. The solid (dashed) gray curve indicates the system’s theoretical stable (unstable) equilibrium points; note that the simulations closely follow the stable equilibrium and that the blue and red curves accordingly overprint the solid gray curve. The three lower insets show the potential for different values of the control parameter . Only for , there exists a stable (closed black circle) and an unstable (open black circle) fixed point, given by the potential’s minimum and maximum, respectively. See SI Appendix, Fig. S3 for a two-dimensional version of this figure.

