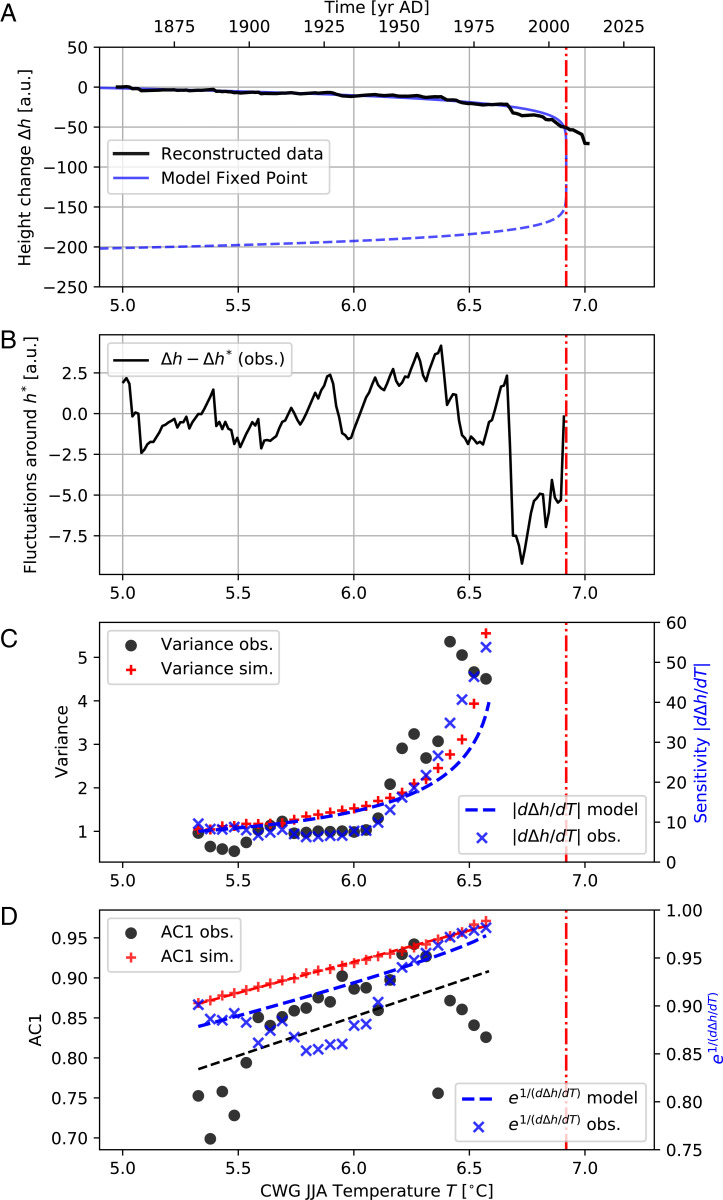
Fig. 3.
(A) Reconstructed CWG ice sheet height change (solid black curve) and corresponding bifurcation diagram of the optimized model given in Eq. 1 (blue curves). The coefficient of determination for fitting the model of Eq. 1 to the height reconstructions is . Stable (unstable) model fixed points are shown in solid (dashed) blue curve. (B) Fluctuations of the reconstructed height change around the stable model fixed point. (C) Variance of the observed fluctuations around the fixed point (black circles), of corresponding simulations of the model given by Eq. 1 with optimized parameters (red plus sign), as well as the sensitivity for the reconstructed observations (blue crosses, estimated by numerical differentiation) and the expected sensitivity of the model (dashed blue curve). (D) Same as C, but for the AC1, compared to the theoretically expected expression (see Materials and Methods). Both variance and AC1 are estimated for sliding window sizes data points, and the initial and final 25 data points are accordingly omitted. These results are robust for different choices of the sliding window size (SI Appendix, Fig. S5) and the parameter used for reconstructing the ice sheet height change (Materials and Methods and SI Appendix, Fig. S6). The critical temperature value is indicated in A–D by the vertical dash-dotted line.

