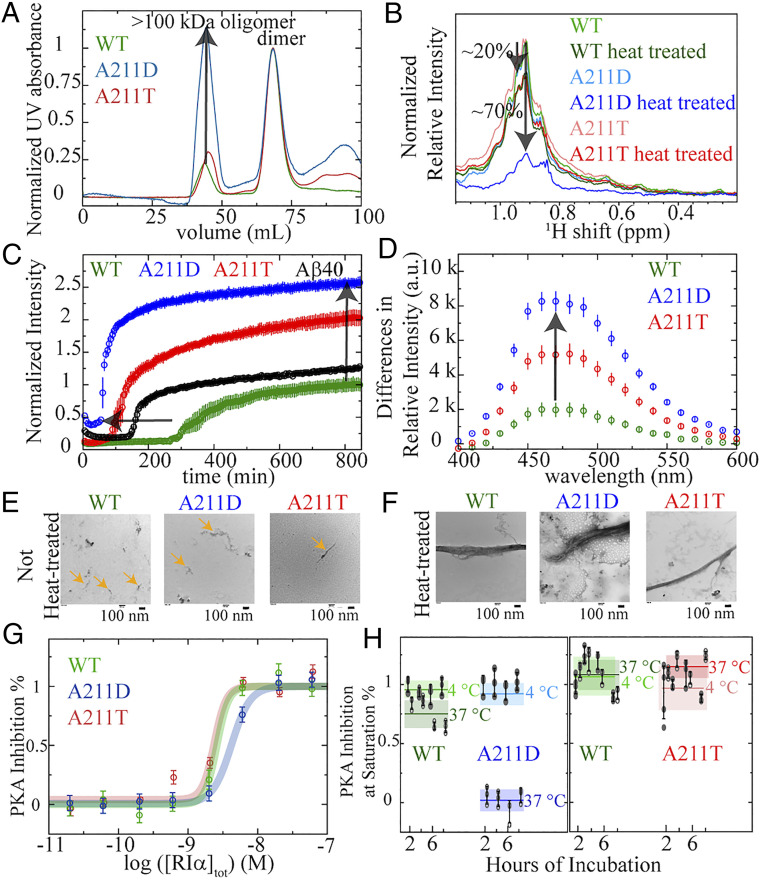
Fig. 4.
Effect of the CNC and ACRDYS1 A211 mutations on PKA R1α self-association, oligomerization, and inhibition of PKA kinase activity. (A) SEC profiles of full-length wt, A211D, and A211T PKA R1α prepared as for the kinase inhibition assays. The intensity of the dimer peaks are normalized to 1. Hence, the relative intensity of the >100-kDa oligomer peak reflects the extent of oligomerization of the PKA R1α dimer. (B) Aggregation probed through 1D 1H NMR methyl intensity losses upon mild heat treatment (i.e., 90-min incubation at 60 °C) of 8 μM PKA R1α in the presence of 10-fold excess cAMP. Mild heat treatment leads to a ∼70% intensity loss for A211D, but only ∼20% for wt and A211T. (C) Kinetics of cross-β-sheet formation as monitored by normalized ThT fluorescence while incubating 8 μM PKA R1α at 60 °C in the presence of 10-fold excess cAMP. The ThT fluorescence profile of Aβ (1–40) serves as a positive control for amyloid formation. Data acquired in triplicate and error is SD. (D) Difference of ANS fluorescence spectra of 8 μM R1α (1–379) with 10-fold cAMP excess before and after heat treatment. The enhanced ANS fluorescence intensity upon heat treatment points to increased exposure of hydrophobic residues. Data acquired in triplicate, and error is SD. (E and F) TEM images of WT, A211D, and A211T PKA R1α assemblies in the presence of 10-fold excess cAMP before, before (E) and after (F) heat treatment (i.e., 14-h incubation at 60 °C). PKA R1α oligomers with sizes of the order of 100 nm are already present prior to heat treatment (orange arrows), suggesting that the heat treatment accelerates oligomerization processes intrinsic to PKA R1α. (G) Nonoligomerized full-length PKA R1α inhibits the kinase activity of PKA C in a dose-dependent manner. This applies to wt, A211T, and A211D. Data acquired in triplicate and error is SD of the plateau region. (H) The PKA R1α oligomers are incompetent to inhibit the kinase activity of PKA C. Thick horizontal lines (shaded rectangles) denote the average (SDs) of all time points measured for each sample (A211D, or A211T, or WT) at each incubation temperature. The boxes with lighter (darker) shades are for incubation at 4 (37) °C. Other color codes are indicated in each panel. Filled gray dots (open circles) represent actual data points acquired with incubation at 4 (37) °C. The inhibitory potency at saturation of PKA C was measured for full-length PKA R1α incubated at 1 μM and 4 or 37 °C in the time range 2–8 h. Data acquired at least in triplicate and error is SD.

