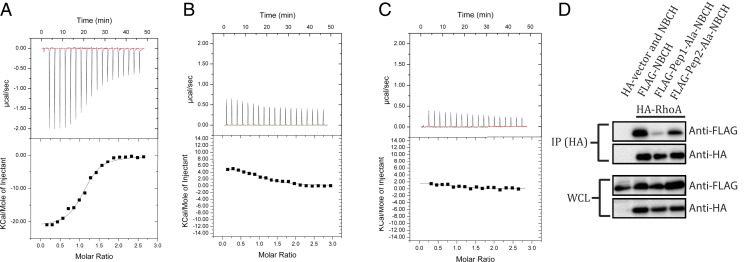
Fig. 3.
Interaction of RhoA with HBCH. The upper panels show the raw ITC data for injection of BCH peptide into the sample cell containing RhoA. The peaks were normalized to the peptide: protein molar ratio and were integrated as shown in the bottom panels. Solid dots indicate the experimental data, and their best fit was obtained from a nonlinear least squares method, using a single site binding model depicted by a continuous line. (A) The titration of the Pep1 peptide (85IIVFSACRMPPSHQLDHSKLLGYLKHTLDQYVESDY120, His97-Lys103 loop shown in underline) against RhoA had a Kd of 1.4 ± 0.5 μM, (B) Pep2 peptide (126HHGLTSDNKPS136, Ser131-Lys134 loop shown in underline) and (C) Pep1-Ala mutant (85IIVFSACRMPPSAALAAAALLGYLKHTLDQYVESDY120) show no binding with RhoA. (D) Coimmunoprecipitation of FLAG-NBCH (WT and mutants) by HA-RhoA using anti-HA magnetic beads. 293T cells were transfected with the expression vectors HA-RhoA or HA-vector and the FLAG-NBCH or its mutants as indicated. Bound protein complexes were resolved on SDS-PAGE and detected by the antibodies indicated. Equal loading of the lysates were demonstrated on the whole-cell lysate section.

