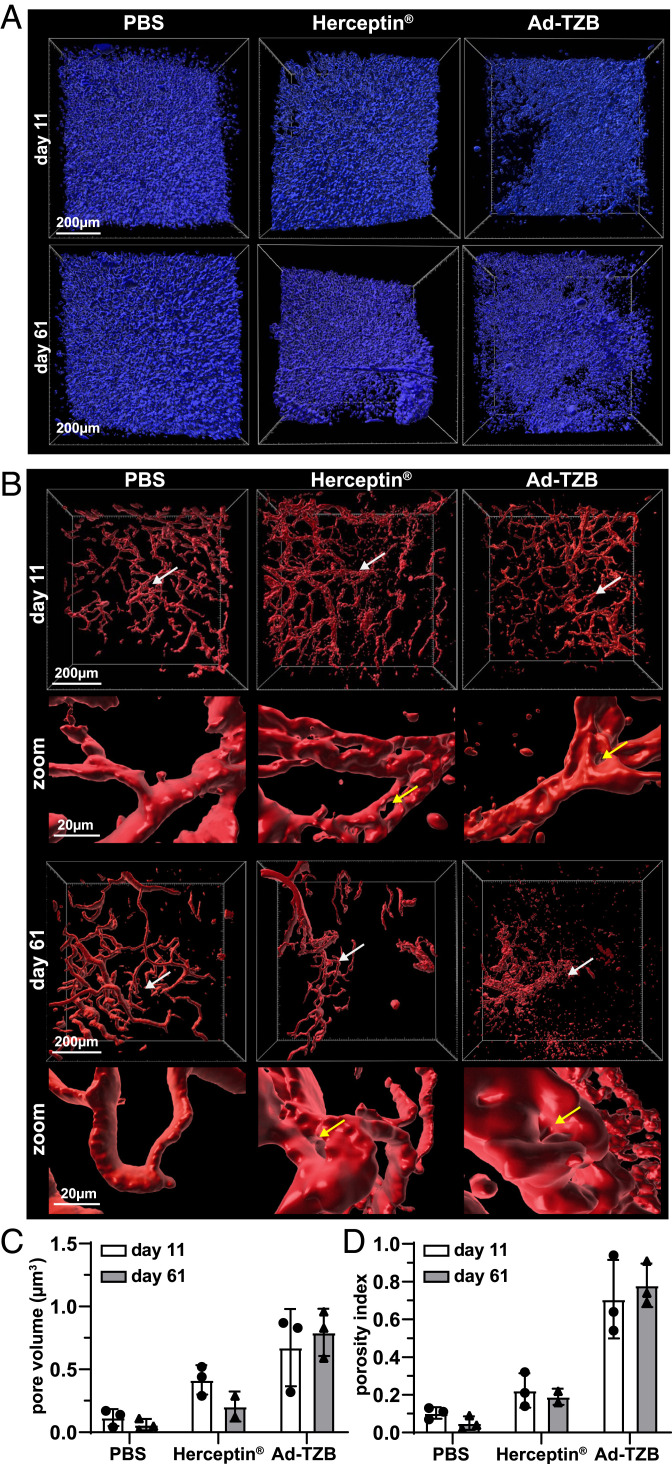
Fig. 7.
Therapeutic efficacy of paracrine-delivered TZB in PACT-cleared HER2-positive BT474 xenografts. (A) Representative DAPI rendering (blue) showing tumor density of PBS- (Left), Herceptin- (Middle), and Ad-TZB–treated (Right) tumors at day 11 (Top) and day 61 (Bottom). (B) Representative vasculature rendering (red) of PBS- (Left), Herceptin- (Middle), and Ad-TZB–treated (Right) tumors at day 11 (Top) and day 61 (Bottom). The region indicated by the white arrows is shown at 10× higher magnification in the zoom panels below each overview image. Examples of pores are shown with yellow arrows. The vasculature images shown correspond to the same frames of samples shown in A above. (C) Quantification of total pore volume (μm3) in tumors as determined by measuring the total area within the tumor that does not stain positively for nuclear DAPI staining, excluding tissue margins. All data points are for n = 3 mice, except Herceptin day 61 where n = 2. For this group, samples were limited at the endpoint, as complete regressions occurred in two of seven mice (of the five remaining, two were used for imaging and three to prepare lysates as shown in SI Appendix, Fig. S8B). Bars represent the means, and error bars indicate SDs; data points from individual mice are shown as black dots (day 11) or triangles (day 61). Data were analyzed with a two-way ANOVA with multiple comparisons and the Tukey post hoc test using GraphPad prism software (version 8.3.1). At day 11: PBS versus Herceptin (n.s.; P > 0.05), PBS versus Ad-TZB (*P ≤ 0.05), Ad-TZB versus Herceptin (n.s.; P > 0.05); at day 61: PBS versus Herceptin (n.s.; P > 0.05), PBS versus Ad-TZB (**P ≤ 0.01), Ad-TZB versus Herceptin (*P ≤ 0.05). (D) Quantification of vasculature porosity index (vessel pore volume/total volume) for PBS-, Herceptin- and Ad-TZB–treated mice 11 d after treatment. As in C, all data points are for n = 3 mice, except Herceptin day 61 where n = 2. Bars represent the means, and error bars indicate SDs; data points from individual mice are shown as black dots (day 11) or triangles (day 61). Data were analyzed with a two-way ANOVA with multiple comparisons and the Tukey post hoc test using GraphPad prism software (version 8.3.1). At day 11: PBS versus Herceptin (n.s.; P > 0.05), PBS versus Ad-TZB (***P ≤ 0.001), Ad-TZB versus Herceptin (**P ≤ 0.01); at day 61: PBS versus Herceptin (n.s.; P > 0.05), PBS versus Ad-TZB (****P ≤ 0.0001), Ad-TZB versus Herceptin (**P ≤ 0.01).

