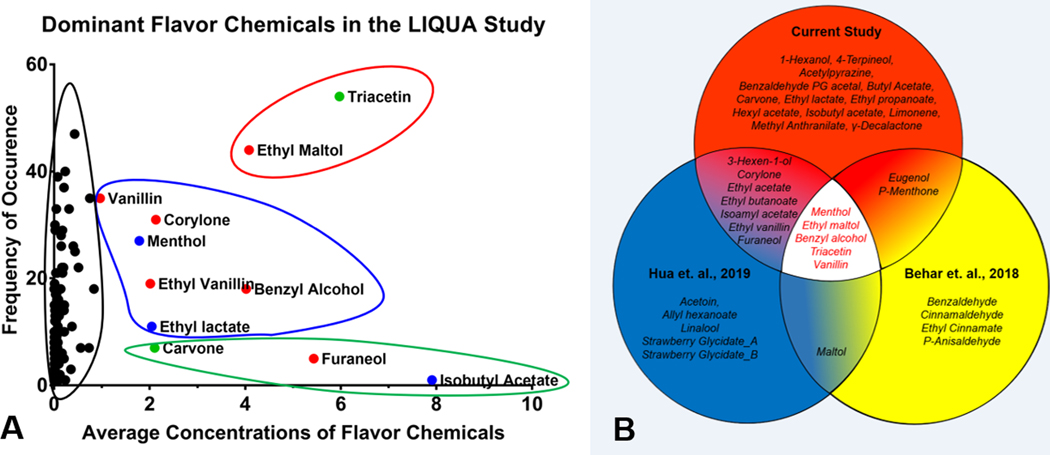
Figure 9.
Dominant flavor chemicals in three refill fluid studies. (a) average concentrations and the number of dominant flavor chemicals in the LIQUA study. The x-axis represents the average concentration of dominant flavor chemicals (> 1 mg/ml) found in the LIQUA EC library, and the y-axis is the frequency of occurrence of each dominant flavor chemicals. Outlines represent different groupings of average concentration and frequency of dominant flavor chemicals; red = high concentration and high frequency, blue = high concentration and mid-frequency, green = high concentration and low frequency, black = low concentration and varying frequency. Colored dots represent hazard classification according to European CLP safety criteria; red = harmful, blue = irritants, green = not determined. (b) Dominant flavor chemicals in three refill fluid libraries. Each chemical in the Venn diagram was present in at least one product in the library at > 1 mg/mL.

