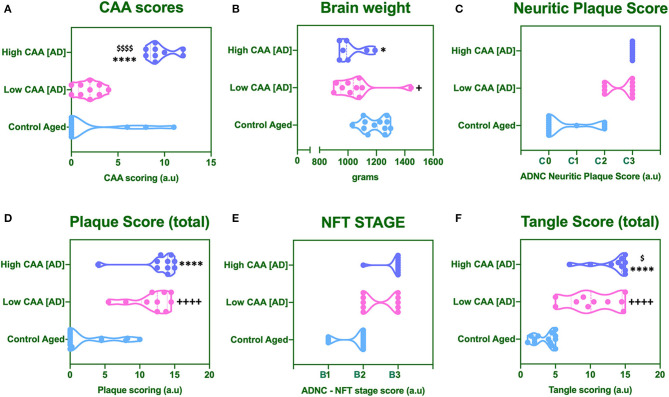
Figure 1.
Cerebral amyloid angiopathy [CAA] (A), mean brain weight in grams (B) and neuropathological scores for Neuritic Plaque (C), Total Amyloid plaque score (D), NFT staging (E), and total tangle pathology score (F). Data was analyzed by one way ANOVA with Holm-Sidak post-hoc test. *P < 0.05 and ****P < 0.0001 (for Control Aged vs. High CAA group); +P < 0.05 and ++++P < 0.0001 (for Control Aged vs. Low CAA group); $P < 0.05, and $$$$P < 0.0001 (for Low vs. High CAA group).

