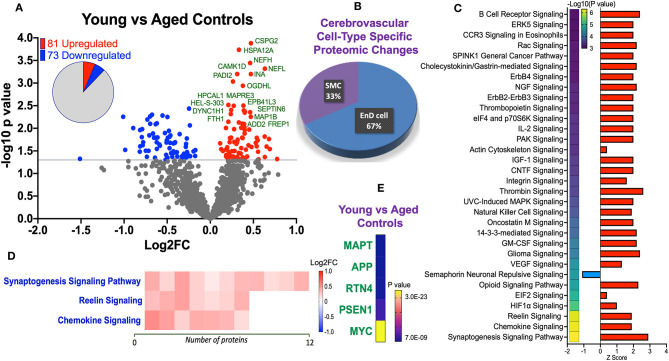
Figure 3.
Proteomic changes, cell origin, signaling pathways, upstream regulator factors observed in the cerebrovasculature isolated from the inferior frontal gyrus of young and aged controls. (A) Volcano plot of differentially expressed proteins in young and aged controls (pie chart inset shows up/down-regulated proteins, significant cut off set at 1.3 and red and blue points indicated up- or down-regulated significant proteins, respectively). (B) Pie Chart show origin of cell types where significant proteins from the comparisons between young and aged controls are observed. Data are generated from the number of significantly regulated proteins per specific cell type (from the PanglaoDB omic database), expressed as a percentage. (C) Canonical pathways identified from ingenuity pathway analyses [data depict –log10 (P-value) and Z score generated from Fischer test of an overlap with the IPA knowledgebase; blue—downregulated and red—upregulated], and (D) shows heat map of the top 3 pathways and the corresponding number of significantly regulated proteins altered per pathway and their Log2 fold change expression level. (E) Shows Top 5 identified upstream regulators from the ingenuity pathway analyses of differentially regulated proteins in young vs. aged control cases.

