
Figure 2. FIGURE 2: Homeostasis and allostasis.
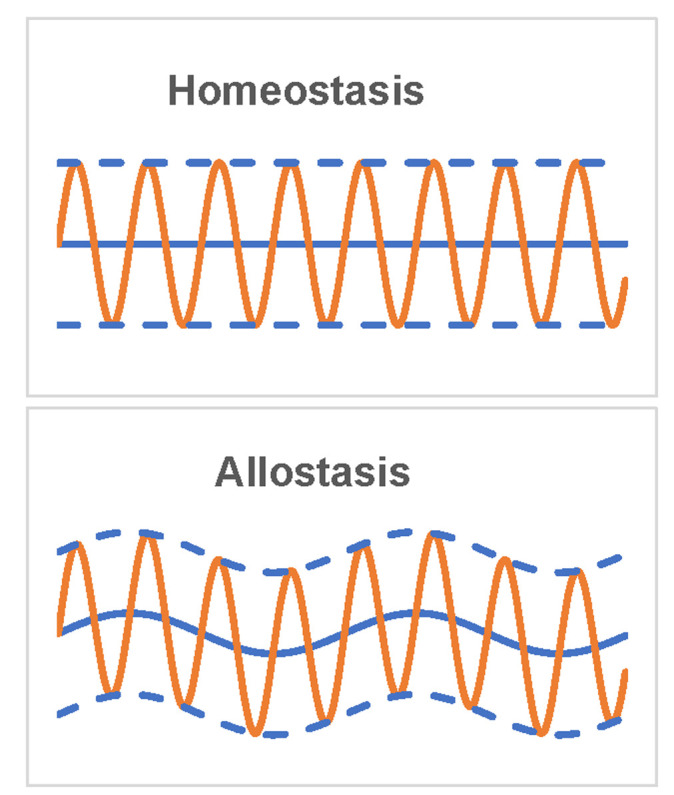
Blue solid line represents the baseline, orange line represents dynamic equilibrium, and blue dot line represents the boundary of dynamic equilibrium.
Official websites use .gov
A
.gov website belongs to an official
government organization in the United States.
Secure .gov websites use HTTPS
A lock (
) or https:// means you've safely
connected to the .gov website. Share sensitive
information only on official, secure websites.
Blue solid line represents the baseline, orange line represents dynamic equilibrium, and blue dot line represents the boundary of dynamic equilibrium.