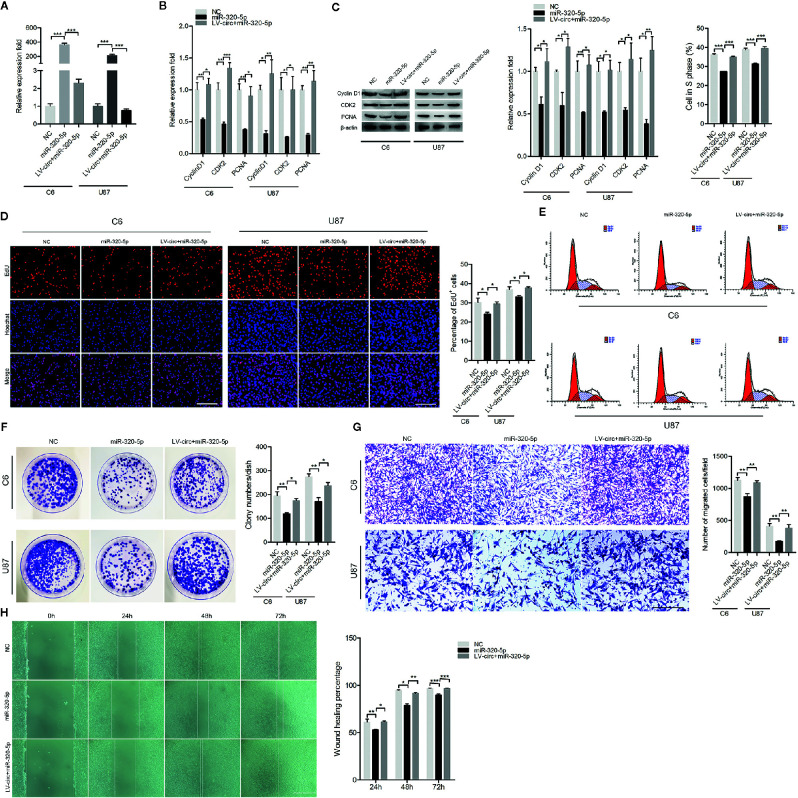
Figure 3.
The effect of miR-320-5p on cell proliferation and migration. (A) RT-qPCR analysis of miR-320-5p expression. (B, C) The mRNA and protein levels of proliferation marker genes were measured by RT-qPCR and western blotting. (D) After 24 h, cell proliferation was detected by the EdU assay. The nuclei were stained with Hoechst dye. Bar = 200μm. (E) Flow cytometric analysis of the cell cycle distribution. (F) Representative micrographs and quantification of crystal violet-stained cell colonies. (G) Transwell assay results of the migration abilities were photographed and counted. Bar = 200μm. (H) After transfection, photographs were taken when the wound was created at 0 h, 24 h, 48h, and 72 h in C6 cells, and the percentages of migrated cells were calculated. Bar = 400μm. The data represent the mean ± SEM of three independent experiments. * P < 0.05; ** P < 0.01; *** P < 0.001 compared with the control.

