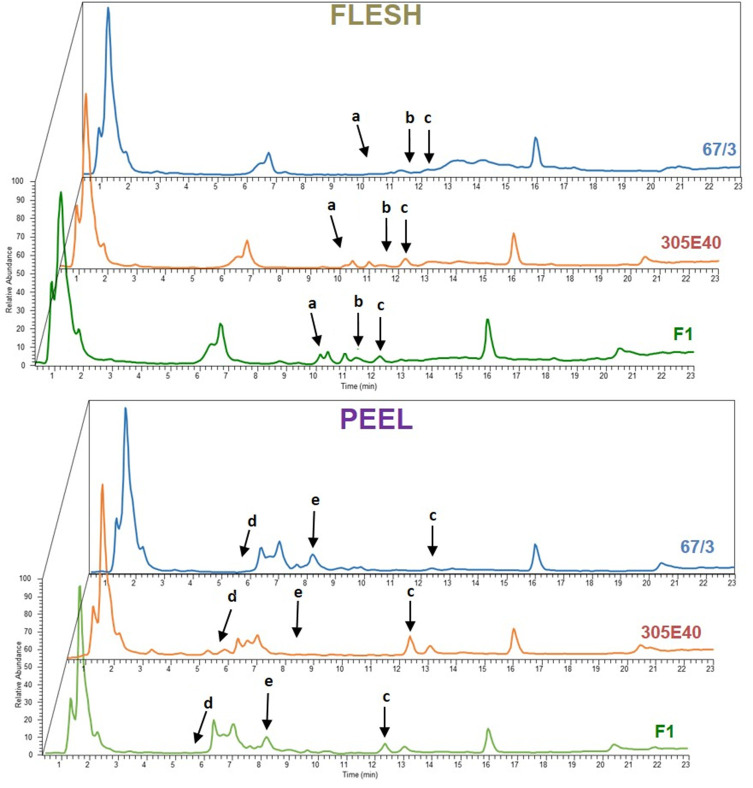
Figure 2.
Representative Total Ion Current (TIC) chromatograms of flesh and peel samples from parental lines “67/3” (blue), “305E40” (orange), and F1 hybrid (green). Arrows indicate differentially expressed peaks: a, solamargine; b, malonylsolamargine; c, pseudoprotodioscin; d, delphinidin-3-rutinoside; e, nasunin.

