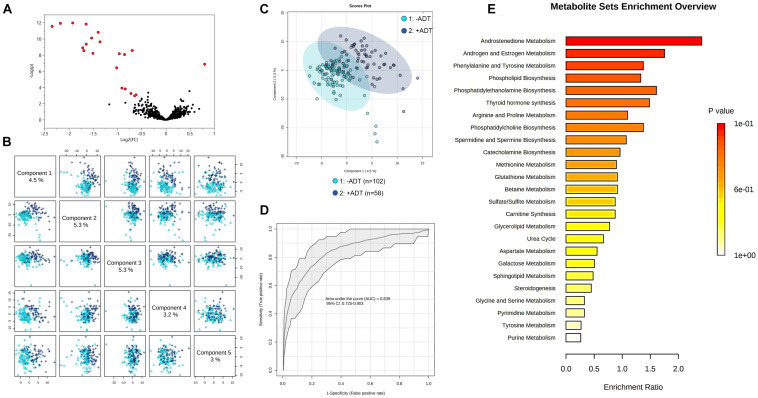
FIGURE 1.
Metabolic profiles of patients with non-metastatic prostate cancer with (+ADT, n = 58) or without androgen deprivation therapy (−ADT, n = 102). (A) Volcano plot of metabolites of the +ADT group compared to −ADT. The y axis represents p-value converted to negative log 10 scale, and the x axis represents log2 fold change. Significant metabolites (fold change > 1.5, FDR ≤ 0.1) were highlighted in red. (B) Pairwise PLSDA score plot of the top five components. (C) PLSDA two-dimensional plot ellipses representing 95% confidence intervals. (D) ROC curve demonstrating the specificity and sensitivity of the PLSDA model discriminating the +ADT group from the −ADT group. AUC = 0.839, 95% CI (0.725, 0.903). Excellent classification is indicated by an AUC > 0.90. (E) Metabolite set enrichment analysis (MSEA) of significant metabolites.

