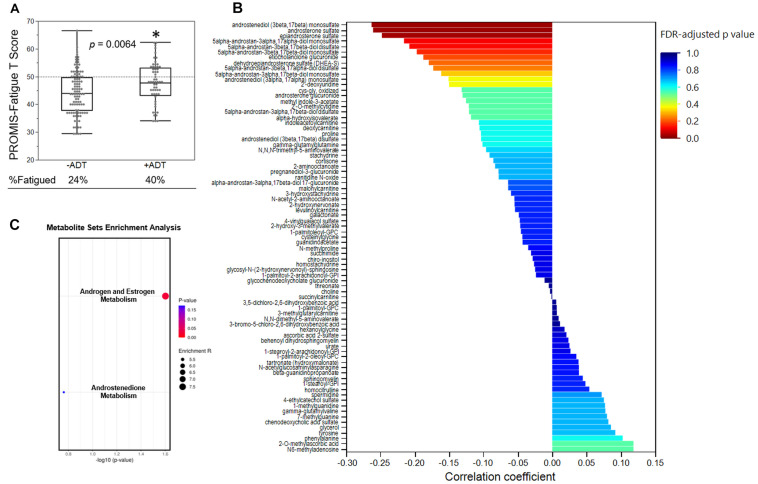
FIGURE 4.
Steroid hormone biosynthesis was associated with fatigue severity. (A) Box plot showing the PROMIS-fatigue T-scores of the −ADT PROMIS-Fatigue T-scores of the −ADT group (44.34 ± 7.81) and the +ADT group (47.92 ± 7.28). *Indicates statistical significance (p = 0.0064). Scores above the dotted lines are considered fatigued (24% of −ADT, 40% of +ADT). (B) Correlations of PROMIS-Fatigue T-score and metabolites that was significantly different between the two groups. X axis indicates the correlation coefficient. Colors of the bars indicate FDR-adjusted p-values. (C) Metabolite set enrichment analysis of metabolites that significantly correlated with PROMIS-Fatigue T-scores. Steroid hormone biosynthesis (KEGG ID: M00107), including androgen and estrogen metabolism (SMPDB ID: SMP0000068) as well as androstenedione metabolism (SMPDB ID: SMP0030406), were significantly overrepresented.

