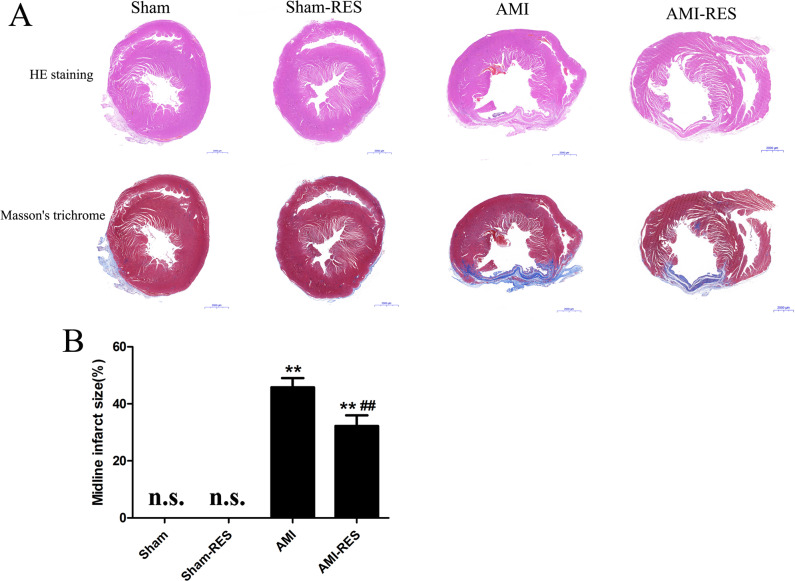
Figure 3. Assessment of atrial fibrosis in the rats from the four groups.
(A) H&E staining (scale bar = 50 µm). (B) Masson’s trichrome staining of collagen fibers (scale bar = 50 µm). (C) Quantification of atrial fibrosis (n = 3 samples per group). The data are expressed as the means ± SDs. ∗∗, P < 0.01 compared with the Sham group. ##, P < 0.01 compared with the AMI group. n.d., not detectable.

