
Figure 6. CyTOF Demonstrates Differential Innate Lymphoid Cell and IL-1β-Related Macrophage/Monocyte Signatures in UC vs CD.
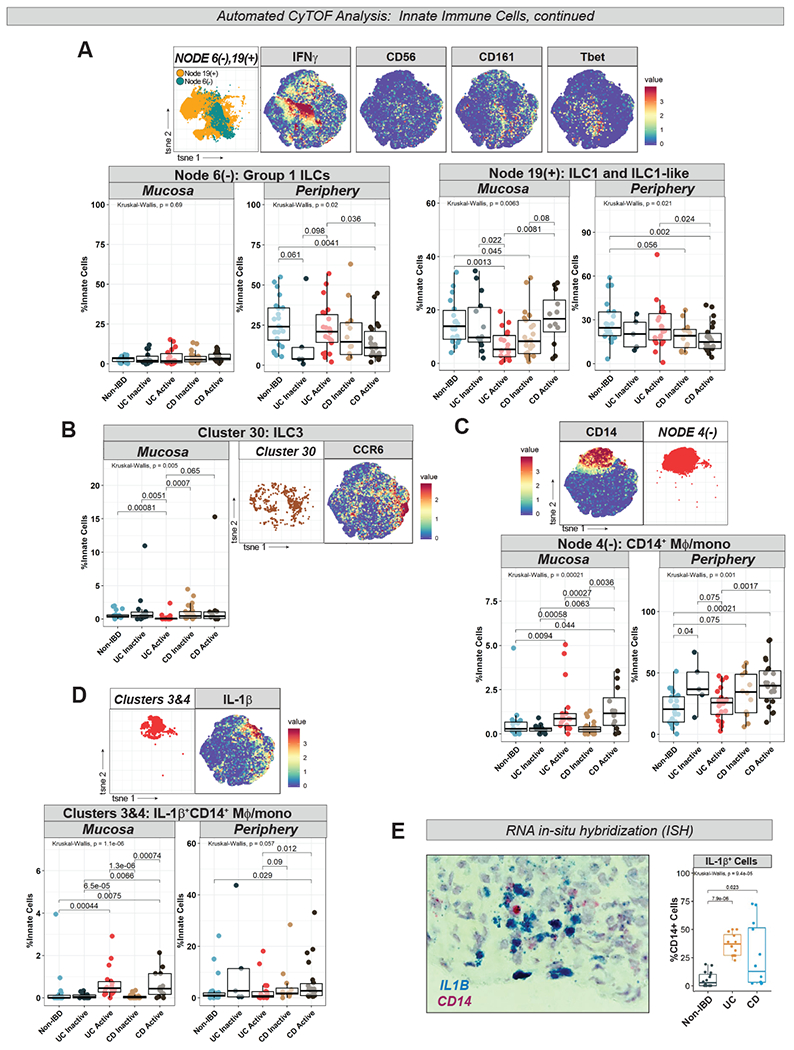
A. Nodes 6(−) and 19(+) (from Fig 5B) abundance plots, t-SNE, and selected marker heatmaps. B. Cluster 30 (from Fig 5B) abundance plot, t-SNE, and CCR6 marker heatmap. C. Node 4(−) (from Fig 5B) abundance plot, t-SNE, and CD14 marker heatmap. D. Clusters 3 and 4 (from Fig 5B) abundance plot (combined), t-SNE, and IL-1β marker heatmap. E. Box-and-whisker plot of IL1B+CD14+ cells counted in ISH images (4 images per subject) with representative image.