
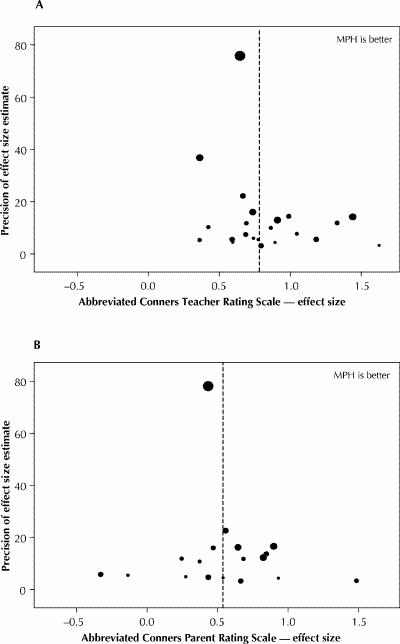
Fig. 5: (A) Funnel plot of methylphenidate effect size for the hyperactivity index (T) versus its precision. The trials' symbols are proportional to sample size (median 32, range 11–161). (B) Funnel plot of methylphenidate effect size for the hyperactivity index (P) versus its precision. The trials' symbols are proportional to sample size (median 37, range 11–161).