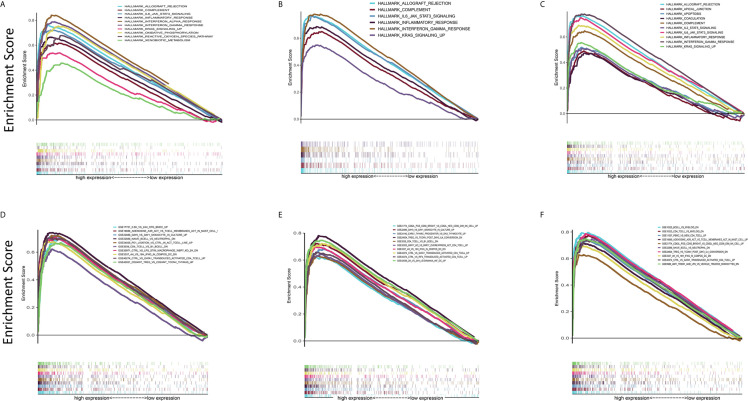
Figure 6.
GSEA of samples with high and low C1qA, C1qB and C1qC expression. (A–C) C1qA, C1qB and C1qC are associated with the gene set enriched in HALLMARK. Each line represents a specific set of genes, with the upregulated genes located at the origin near the coordinates on the left and the downregulated genes located on the right side of the x-axis. FDR q < 0.05 and NOM p < 0.05 were considered significant. Only a few leading gene sets are displayed in the figure panels. (D–F) Expression of genes in the C7 gene set (immunological gene set) in samples stratified by C1qA, C1qB or C1qC expression. Only a few gene sets with high NOM and FDR values are shown.

