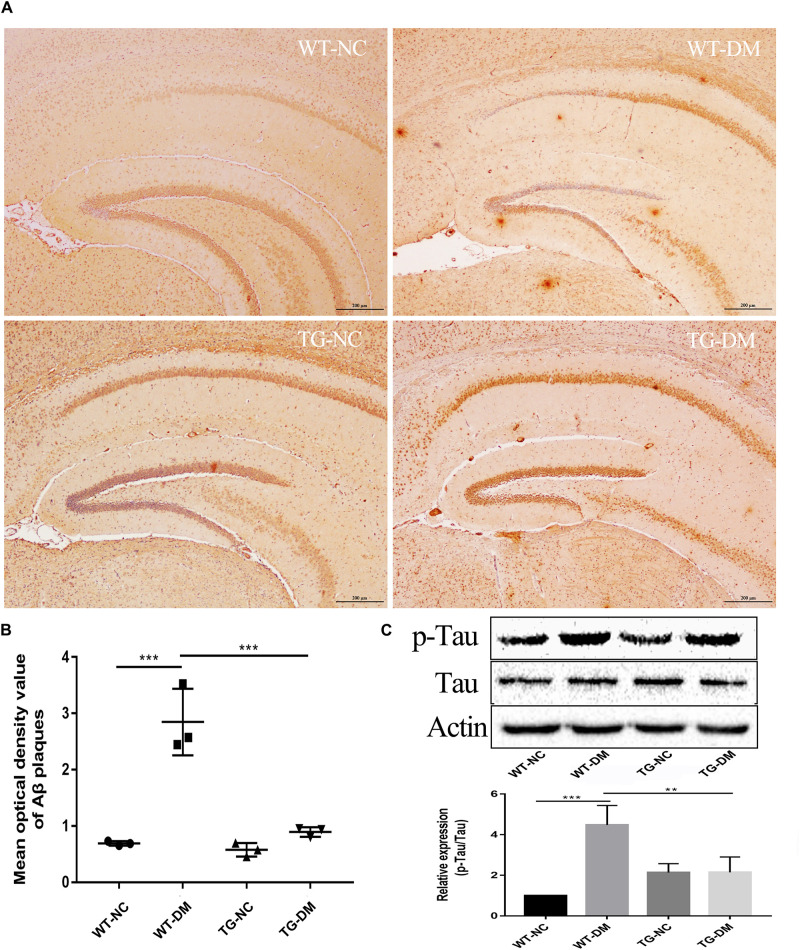
FIGURE 3.
Trx-1 reduced Aβ burden and Tau phosphorylation in DM mice. (A) Representative images of Aβ deposits in the hippocampus. (B) Quantitative statistical analysis of Aβ density value in the hippocampus. (C) Representative Western blot images and analysis of Tau and p-Tau. Tukey’s post hoc test for one-way ANOVA used for Aβ density value and Western blot immunocontent. For each group, n = 6. The vertical lines represent the standard error of the mean. **p < 0.01, ***p < 0.001.

