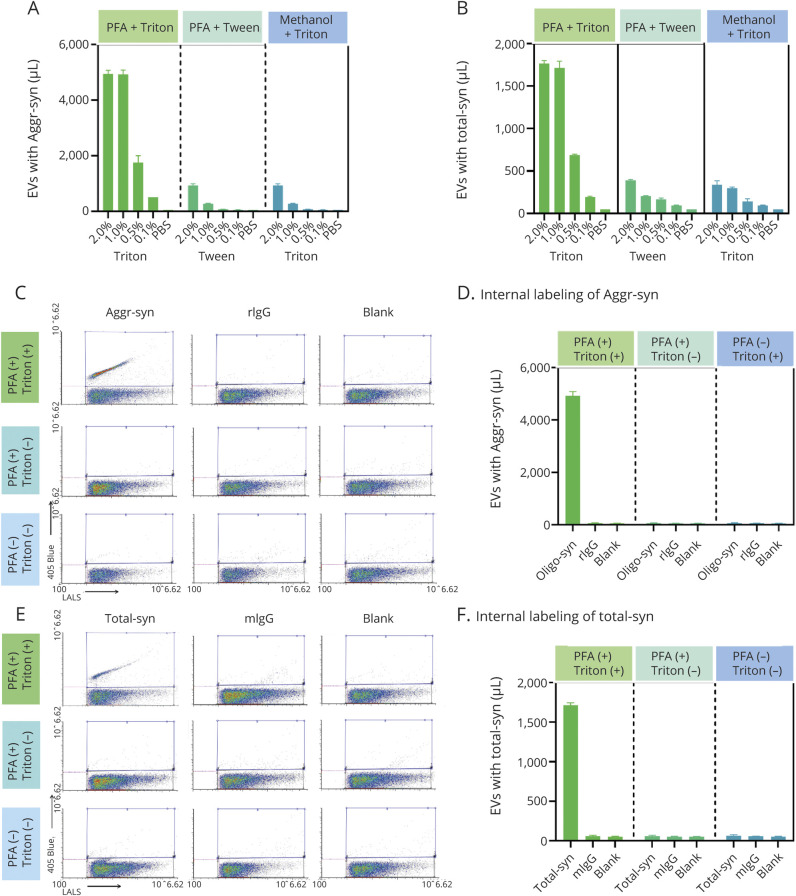
Figure 2. Optimization of Aggregated α-Synuclein (α-Syn) or Total α-Syn Apogee Nanoscale Flow Cytometry Assay System.
(A, B) For intravesicular labeling of aggregated α-syn (A) or total α-syn (B) carrying extracellular vesicles (EVs) in CSF, multiple fixation (to retain the target protein in the original vesicle location) and permeabilization (to allow the antibodies to enter) pairs were tested, including paraformaldehyde (PFA)/Triton, PFA/Tween, and methanol/Triton at different concentrations. The PFA (4%)/Triton (1%) pair demonstrated the best efficiency (positive events in CSF) and was selected for further measurements in this study. (C–F) To confirm the specificity of the intravesicular labeling and Apogee assay measurements, CSF samples with (PFA+) or without (PFA−) fixation and with (Triton+) or without (Triton−) permeabilization were tested for aggregated α-syn (C and D) or total α-syn (E and F) carrying EVs. Samples were labeled with anti-aggregated α-syn (Aggr-syn) or total α-syn (Total-syn) antibodies, or corresponding immunoglobulin G (IgG) isotype controls (rabbit IgG [rIgG] and mouse IgG [mIgG]) and no antibody “blank” as negative controls. In representative cytograms (C and E) acquired from the Apogee instrument, the x axis shows values obtained at the large angle light scatter (LALS), and the y axis shows the log fluorescence intensity measured on 405 blue laser; blue frames represent regions of interest of the target (aggregated α-syn or total α-syn). The quantitative data (EV concentrations) is shown in corresponding histograms (D and F). All measurements were acquired from at least 3 replicates, and the data are shown as mean ± SD.

