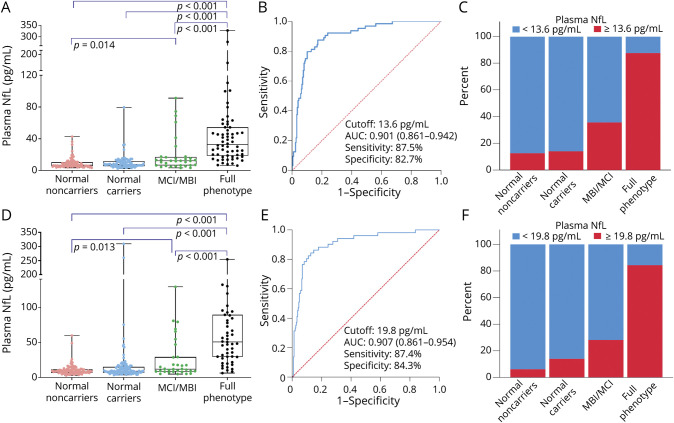
Figure 2. Baseline Plasma NfL Concentrations by Disease Severity and Diagnostic Performance.
(A–C) Original (Longitudinal Evaluation of Familial Frontotemporal Dementia Subjects [LEFFTDS]/Advancing Research and Treatment in Frontotemporal Lobar Degeneration [ARTFL]) cohort. (D–F) Validation (Genetic Frontotemporal Dementia Initiative [GENFI]) cohort. Severity was determined by the CDR Dementia Staging Instrument plus Behavior and Language domains from the National Alzheimer's Disease Coordinating Center Frontotemporal Lobar Degeneration module (CDR+NACC-FTLD). (A and D) Boxplots show plasma neurofilament light chain (NfL) concentrations in asymptomatic carriers (i.e., CDR+NACC-FTLD score 0), those with mild behavioral or cognitive impairment (mild behavioral impairment/mild cognitive impairment [MBI/MCI], CDR+NACC-FTLD score 0.5), and patients with full phenotypes (CDR+NACC-FTLD score ≥1). Horizontal bars represent median values. Upper and lower quartiles are delimitated by the boxes. Lowest and highest values are indicated by whiskers. (B and E) Receiver operating characteristic (ROC) curves show that plasma NfL was a good discriminator between individuals with full phenotype and those either asymptomatic or with MBI/MCI. (C and F) Proportion of patients with low or high plasma NfL concentrations, determined by the ROC curve, is presented for each disease severity. AUC = area under the curve.

