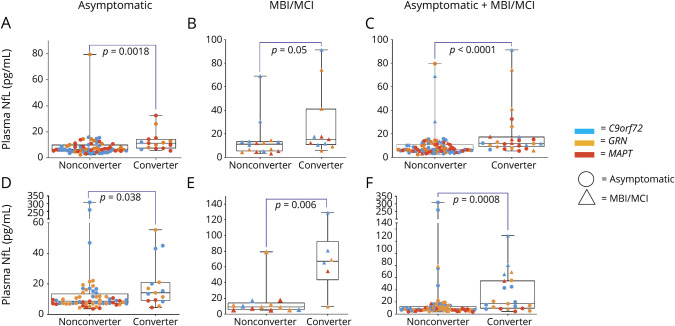
Figure 4. Baseline Plasma NfL Concentrations According to Conversion Status by Follow-Up.
Severity was determined with the CDR Dementia Staging Instrument plus Behavior and Language domains from the National Alzheimer's Disease Coordinating Center Frontotemporal Lobar Degeneration module (CDR+NACC-FTLD). (A–C) Original (Longitudinal Evaluation of Familial Frontotemporal Dementia Subjects [LEFFTDS]/Advancing Research and Treatment in Frontotemporal Lobar Degeneration [ARTFL]) cohort. (D–F) Validation (Genetic Frontotemporal Dementia Initiative [GENFI]) cohort. (A and D) Median baseline neurofilament light chain (NfL) concentrations were higher in asymptomatic mutation carriers (CDR+NACC-FTLD score 0) who progressed to either mild behavioral or cognitive impairment (MBI/MCI; CDR+NACC-FTLD score 0.5) or full phenotype (CDR+NACC-FTLD score ≥1) on follow-up. (B and E) A similar trend was observed in individuals who had MBI/MCI at baseline and when all participants (asymptomatic mutation carriers and those with MBI/MCI) were combined (C and F). Horizontal bars represent median values. Upper and lower quartiles are delimitated by the boxes. Lowest and highest values are indicated by whiskers. Circles = asymptomatic; triangles = MBI/MCI; blue = chromosome 9 open reading frame 72(C9orf72) mutation carriers; red = microtubule-associated protein tau (MAPT) mutation carriers; yellow = progranulin (GRN) mutation carriers;.

