Abstract
Objective
To characterize age-related clinical heterogeneity in Alzheimer disease (AD) and determine whether it is modified by APOE genotype or concomitant non-AD pathology, we analyzed data from 1,750 patients with sporadic, pathologically confirmed severe AD.
Methods
In this retrospective cohort study, regression and mixed effects models assessed effects of estimated age at onset, APOE genotype, and their interaction on standardized clinical, cognitive, and pathologic outcome measures from the National Alzheimer's Coordinating Center database.
Results
A bimodal distribution of age at onset frequency in APOE ε4− cases showed best separation at age 63. Using this age cutoff, cases were grouped as ε4− early-onset AD (EOAD) (n = 169), ε4+ EOAD (n = 273), ε4− late-onset AD (LOAD) (n = 511), and ε4+ LOAD (n = 797). Patients with EOAD were more likely than patients with LOAD to present with noncognitive behavioral or motor symptoms or nonmemory cognitive complaints, and had more executive dysfunction, but less language impairment on objective cognitive testing. Age at onset and ε4− genotype were independently associated with lower baseline Mini-Mental State Examination scores and greater functional impairment and patients with EOAD had faster cognitive and functional decline than patients with LOAD regardless of APOE genotype. Patients with EOAD were more likely than patients with LOAD to receive a non-AD clinical diagnosis even though they were more likely to have pure AD without concomitant vascular or other non-AD neurodegenerative pathology.
Conclusions
Early-onset sporadic AD is associated with a greater likelihood of an atypical, non-memory-dominant clinical presentation, especially in the absence of the APOE ε4 allele, which may lead to misattribution to non-AD underlying pathology.
Despite a shared basic pathology across the age range,1 Alzheimer disease (AD) is known for age-related heterogeneity in its clinical and neuropathologic presentation,2,3 posing diagnostic challenges for clinicians. Studies suggest that individuals with early-onset AD (EOAD) (typically defined as age <65) have faster cognitive decline than those with late-onset AD (LOAD),4-7 less prominent memory impairment,8-11 and more often present as focal cortical syndromes such as primary progressive aphasia (PPA),12 posterior cortical atrophy,13-16 or frontal variant AD.17-19 These atypical presentations of EOAD are especially common in the absence of the APOE ε4 AD risk allele,20,21 and are susceptible to being misattributed to non-AD causes. Because many studies did not include autopsy verification, it is impossible to know whether age-related clinical and cognitive heterogeneity occurred in the context of typical AD pathology or depended upon differences in the extent and severity of AD pathology, non-AD pathology superimposed on AD, or non-AD pathology alone. Therefore, we examined the relationship between age at onset and the clinical presentation of dementia in individuals with autopsy-confirmed severe AD in the large, multicenter National Alzheimer's Coordinating Center (NACC) database. The contribution of concomitant non-AD neuropathology to potential age-related differences was also examined. We hypothesized that those with EOAD, especially without the APOE ε4 risk allele, are more likely than those with LOAD to have atypical clinical and cognitive presentations, resulting in greater misattribution of the underlying pathology to non-AD causes.
Methods
Case Selection
Data were drawn from the September 2019 data freeze of the NACC database,22,23 which collects standardized data from Alzheimer's Disease Centers (ADCs) across the United States. Due to major changes in data collected under version 3 of the NACC Uniform Data Set (UDS), this study was restricted to those with clinical data collected under UDS versions 1 and 2 spanning 2005–2015. Within these parameters, we identified 2,830 patients with a pathologic diagnosis of severe AD, defined as Braak stage V–VI with moderate/severe density of neuritic plaques (i.e., “high likelihood” by National Institute on Aging–Reagan criteria24). As our focus was sporadic AD, cases were excluded if they had a known dominantly inherited mutation for AD (e.g., APP; n = 42), a family history of such a mutation (n = 8), Down syndrome (n = 4), or a reported age at onset younger than 50 (n = 115), which may indicate an unknown/de novo autosomal-dominant mutation.25 Cases were also excluded if essential data were missing, such as reported age at onset (n = 209) or APOE genotype (n = 315), or if the last valid Mini-Mental State Examination (MMSE) score was more than 5 years before death (n = 494). Ultimately, 1,750 cases of pathologically confirmed severe AD at death were included in this study.
Neuropathologic Analysis
Data reported to NACC by each ADC neuropathologist included a diagnosis and specific pathologic findings defined in a NACC Coding Guidebook (alz.washington.edu). In addition to Braak staging and staging of neuritic plaque density (Consortium to Establish a Registry for Alzheimer’s Disease score), we utilized information on the presence/absence of arteriosclerosis, microinfarcts, macroinfarcts/lacunae, and hemorrhages/microbleeds. Atherosclerosis of the Circle of Willis and amyloid angiopathy were each rated on a 4-point scale (none, mild, moderate, severe), and are dichotomized as moderate/severe vs none/mild in our analyses. Lewy body disease (LBD) pathology included brainstem-predominant, limbic (i.e., transitional), and neocortical (i.e., diffuse) subtypes. Data on the amygdala predominant and olfactory bulb subtypes was available in a subset of 809 (46%) participants. Hippocampal sclerosis was not identified separately in the earlier NACC UDS 1 and 2, but instead included under a diagnosis of medial temporal lobe (MTL) sclerosis. Due to extensive changes in reporting practices in NACC over the years,26 all frontotemporal lobar degeneration (FTLD) pathologies (e.g., Pick disease, progressive supranuclear palsy [PSP], corticobasal degeneration [CBD], tangle-only disease, argyrophilic grain dementia, FTLD-TDP43) are grouped together in analyses. Data on TDP-43 immunostaining in the amygdala, hippocampus, and neocortex were available in a subset of 368 (21%) participants for staging of limbic-predominant age-related TDP-43 encephalopathy (LATE).27
Clinical Assessment and Diagnosis
At baseline and subsequent visits that occurred at approximately 1-year intervals, participants received a standardized dementia evaluation28 that included medical history (active or remote), family history, physical and neurologic examination, review of medications, neuropsychological testing, and functional assessment with the Clinical Dementia Rating (CDR Dementia Staging Instrument) and the Functional Assessment Questionnaire (FAQ). Psychiatric symptoms were assessed with the Geriatric Depression Scale (GDS) and the Neuropsychiatric Inventory (NPI). Cognition was assessed with a neuropsychological test battery29 that consisted of the MMSE and measures of verbal learning and memory (Logical Memory Test [story A only] I and II), attention and executive function (Digit Span Forward and Digit Span Backward; Trail-Making A and B; Digit Symbol Substitution), and language/semantic memory (30-item Boston Naming Test, Animal and Vegetable Fluency). The predominant symptom first recognized in “cognition,” “behavior,” or “motor” domains (when present) was recorded. Estimated age at onset of cognitive decline was determined by the clinician through an interview with a knowledgeable informant/study partner.
At each visit, a clinical diagnosis was assigned based on a review of all available clinical data. The clinical diagnostic procedure included determining whether mild cognitive impairment (MCI), dementia, or cognitive impairment–not MCI was present. Next, presence was noted of conditions such as probable or possible AD, probable or possible vascular dementia, frontotemporal dementia (FTD) (including behavioral-variant FTD, PPA, PSP, and CBD), LBD (dementia with Lewy bodies or Parkinson disease), or various other conditions that result in cognitive impairment. Of those conditions present, one was chosen as the “primary” contributor to the cognitive impairment, while others could be listed as “contributing” or “present but not contributing” to cognitive impairment.
Baseline visit was defined as the first visit at which the participant received a non-normal diagnosis. Baseline was the first ADC visit for a vast majority of the cases; however, some patients (n = 140; 8%) entered the study as cognitively normal and were only classified as impaired at a later ADC visit. Last visit was defined as the last visit prior to death during which UDS version 1 or 2 data were collected. The baseline visit was also the last visit for 18.2% of the cases.
Statistical Analysis
Density distributions of the estimated age at onset by the number of APOE ε4 alleles were plotted for the 1,750 cases. The bimodal distribution in the ε4-negative (ε4−) population was fit well by a 2-component gaussian mixture model (p < 0.001) using an expectation maximization algorithm with the mixtools package for R.30 The point of intersection between the 2 distributions was determined to be approximately 63 years of age, which was used to dichotomize cases as EOAD (age ≤63) or LOAD (age >63). Although the cut point was derived from the ε4− population only, it was also applied to the ε4+ cases to allow us to more easily probe separate effects of APOE and age at onset and their interaction. APOE genotype was collapsed into ε4− (ε3ε3; ε2ε3; ε2ε2) and ε4+ (ε2ε4; ε3ε4; ε4ε4) categories in analyses. In order to illustrate the results of the various analyses, cases were divided into 4 groups and group means and SDs are presented in tables and figures: EOAD ε4− (n = 169), EOAD ε4+ (n = 273), LOAD ε4− (n = 511), and LOAD ε4+ (n = 797).
Effects of age at onset, APOE genotype, and the age at onset × APOE genotype interaction were examined by linear regression for continuous variables and logistic regression for dichotomous clinical and neuropathologic variables. If the interaction term was not significant it was dropped from the model and only main effects were reported to allow for simple interpretation. Sex distributions differed by age at onset (table 1), so sex was included as a covariate in all subsequent analyses. We report the β coefficients and 99% confidence intervals (CIs) for linear regression and the odds ratio (OR) and 99% CI for logistic regression.
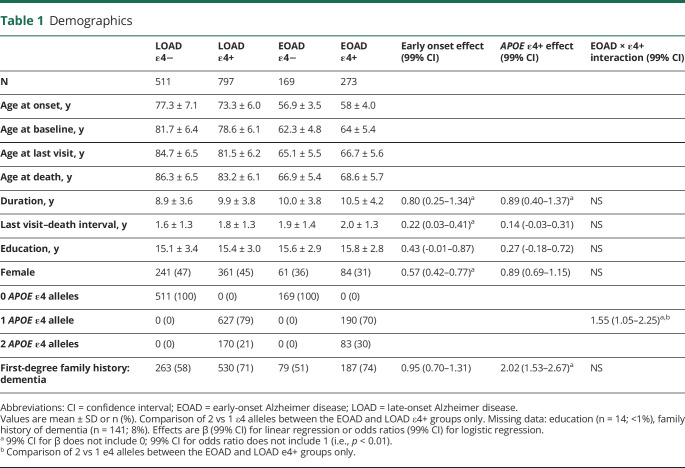
Table 1.
Demographics
Cognitive domain scores were created to examine cognitive profiles at baseline. Patients' raw scores on each cognitive test were converted to z scores relative to robust normal control participants (individuals who remained cognitively normal throughout all of their evaluations in NACC). Matching performed with the MatchIt R package31 using exact sex matching and nearest-neighbor age matching in a ratio of 5 robust controls to 1 case was done separately for EOAD and LOAD populations. A small percentage of cognitive data (<5% per test) were imputed using the missMDA R package.32 Principal component analysis with Varimax rotation identified 4 components that were conceptually labeled as “executive,” “memory,” “language,” and “attention” based on the primary loadings. The 4 component scores (i.e., cognitive domain scores) were generated for each participant (centered and scaled relative to matched robust normal controls) and separately examined in regression models with linear adjustments for sex and education.
To examine progression, longitudinal change on the MMSE and CDR sum of boxes (CDR-SOB) for up to 5.5 years from baseline was examined using linear mixed effects models with terms for age at onset, APOE genotype, age at onset × APOE genotype, and their interactions with time. Models were adjusted for sex, education, baseline score, and their interactions with time. MMSE scores of 0 after the first 0, and CDR-SOB scores of 18 after the first 18, were dropped before model fitting to minimize floor effects.
Standard Protocol Approvals, Registrations, and Patient Consents
The research protocol was approved at each ADC's institutional review board and written informed consent was obtained from participants at each ADC.
Data Availability
NACC has developed and maintains a large relational database of standardized clinical and neuropathologic research data collected from the National Institute on Aging–funded ADCs across the United States. NACC data are freely available to all researchers at alz.washington.edu/.
Results
Participant Demographic Characteristics
The participants with severe AD pathology selected for this study (n = 1750) had a mean ± SD age of 75.6 ± 9.4 years at their baseline ADC clinical assessment, 15.4 ± 3.1 years of education, and 43% were female. The average baseline MMSE score was 19.5 ± 7.9. The APOE genotype distribution was 61% ε4+ and 39% ε4−. The average estimated age at onset was 70.5 ± 9.7 years, age at death was 80.3 ± 9.5 years, and overall duration of illness was 9.7 ± 3.9 years. The average age at the last ADC evaluation was 78.5 ± 9.6 years, the last MMSE score was 13.9 ± 8.2, and the interval between the last evaluation and death was 1.8 ± 1.3 years.
Distribution of Age at Onset by APOE Genotype
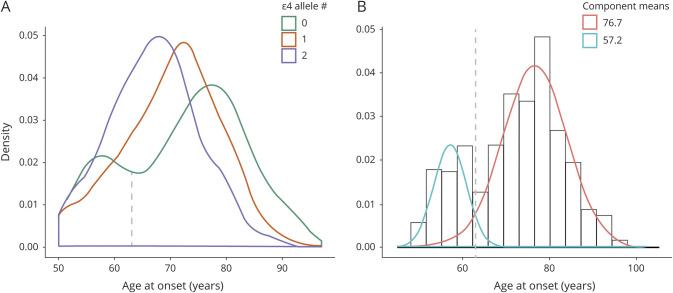
Density distributions of the estimated ages at onset by the number of APOE ε4 alleles (figure 1A) showed the expected dose-dependent shift of the major peaks to an earlier age at onset as the number of ε4 alleles increased. A 2-component gaussian mixture model fit only to the ε4− individuals (p < 0.001) identified 2 underlying distributions (figure 1B), one peaking at age 76.7 ± 7.5 years and accounting for 78% of the cases, and another peaking at age 57.2 ± 3.8 years and accounting for 22% of the cases. The point of intersection between these 2 distributions (the age at onset, which is equally likely to belong to both) was age 63.0 years.
Figure 1. Distribution of Ages at Onset by APOE Genotype.
(A) Plot of the density distributions split by the number of APOE ε4 alleles (smoothed histograms that integrate to 1 for each group) shows a marked bimodal distribution for the ε4-negative population. (B) Two-component gaussian mixture model only of this ε4-negative population fit the data well and identified 2 underlying normal distributions: the larger distribution (red) accounted for 78% of the cases with a peak at age 76.7 and an SD of 7.5, while the smaller distribution (blue) accounted for 22% of the cases with a peak at age 57.2 and an SD of 3.8. The point of intersection between these 2 distributions was age 63.0 (vertical gray dotted lines in both panels): this point was chosen as the distinction between early onset and late onset in this study regardless of APOE genotype.
Participant Demographic Characteristics as a Function of Age at Onset and APOE Genotype
Patients with EOAD had longer duration of illness than patients with LOAD by 0.80 years (99% CI, 0.25–1.34) and a longer interval from last evaluation to death by 0.22 years (99% CI, 0.03–0.41) (table 1). Presence of an ε4 allele was associated with a longer duration of illness by 0.89 years (99% CI, 0.40–1.37). Patients with EOAD were less likely to be female (OR, 0.57; 99% CI, 0.42–0.77) than were patients with LOAD. When ε4+, patients with EOAD were more likely than patients with LOAD to have 2 rather than 1 ε4 allele (OR, 1.55; 1.05–2.25). APOE ε4+ patients were more likely than APOE ε4− patients to have had a first-degree relative with dementia (OR, 2.02; 99% CI, 1.53–2.67). There were no significant interactions of APOE genotype with age at onset.
Clinical Assessment and Diagnosis
Presenting Symptoms
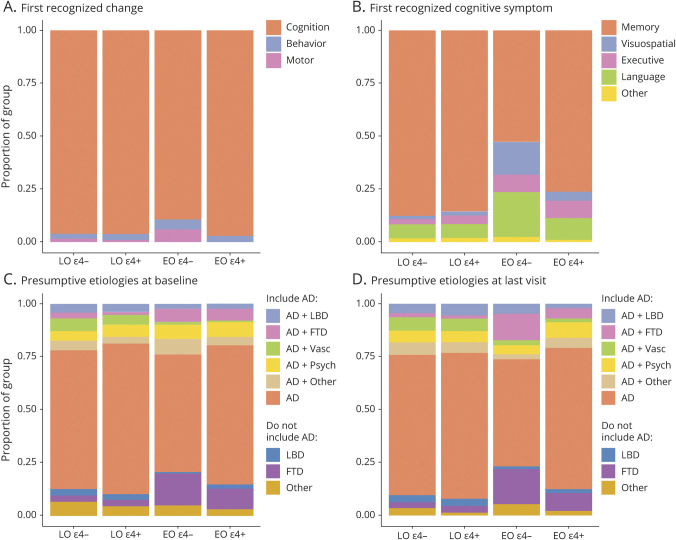
Most patients reported that cognitive symptoms occurred first; however, patients with EOAD were more likely than patients with LOAD to report noncognitive (i.e., behavioral or motor) symptoms first (OR, 2.70; 99% CI, 1.17–6.13), and this was particularly true for ε4− patients with EOAD, as shown by a significant age at onset × APOE genotype interaction effect (p < 0.01) (figure 2A). When cognitive symptoms occurred first, the first symptom was usually memory impairment (figure 2B), but patients with EOAD were more likely than patients with LOAD to report nonmemory cognitive symptoms first (OR, 5.56; 3.32–9.39). This was again particularly true for ε4− patients with EOAD, as shown by a significant age at onset × APOE genotype interaction effect (p < 0.01).
Figure 2. Clinical Presentation and Diagnosis.
(A) Proportion of patients reporting cognition, behavior, or motor impairments as the first recognized change, plotted as a function of age at onset and APOE genotype. The colors of the bars represent the proportion of which mutually exclusive outcome was reported in each group. Missing data for n = 22 (1%). (B) Distribution of which specific cognitive symptom was first recognized in the participant, plotted as a function of age at onset and APOE genotype. The “other” group includes rare reports of the first symptom being orientation (n = 1; <1%), attention/concentration (n = 23; 1%), and other write-ins (n = 8; <1%). Missing data for n = 8 (<1%). (C, D) Clinically assigned presumptive etiologies reported as either “primary” or “contributing” to the cognitive impairment at baseline and last visit (closest to death). The etiology combinations that correctly included Alzheimer disease (AD) are represented with pastel colors at the top; those that missed AD in error are in darker tones at the bottom of the figure. The “AD + other” and non-AD “other” groups include other combinations in the presence or absence of AD, respectively, that account for <5% of the total sample. Missing data for n = 109 (6%) at baseline and n = 10 (<1%) at final visit. EO = early onset; FTD = frontotemporal dementia; LBD = Lewy body disease; LO = late onset.
Clinical Rating Scales
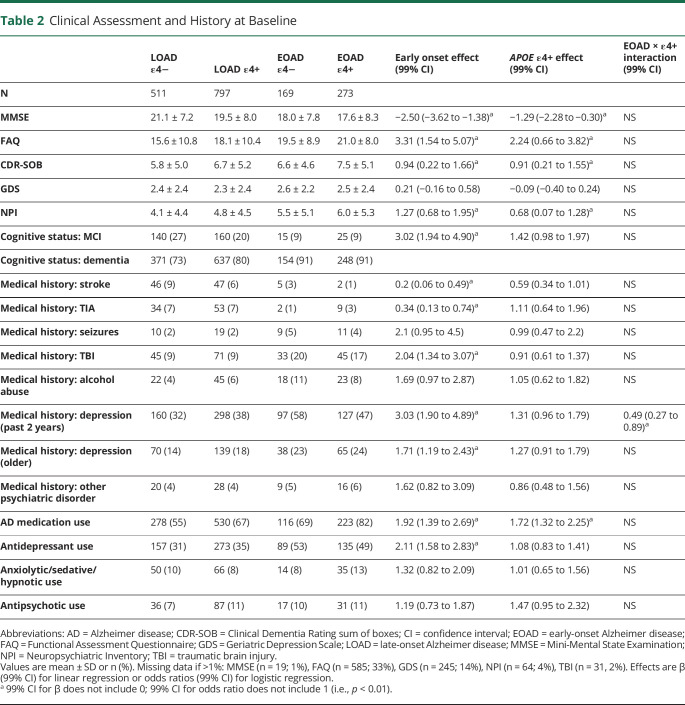
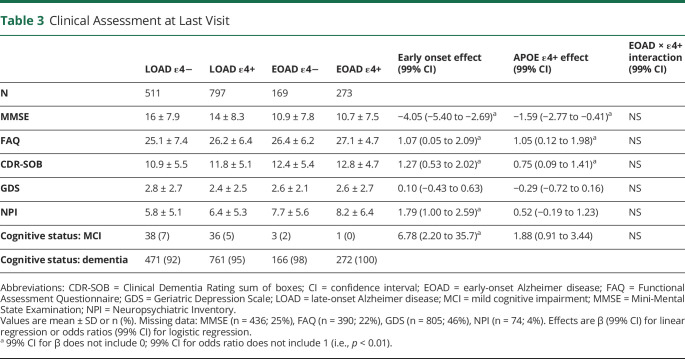
Patients with EOAD had lower MMSE scores by 2.50 points (99% CI, 1.38–3.62), higher (i.e., worse) FAQ scores by 3.31 points (99% CI, 1.54–5.07), higher (i.e., worse) CDR-SOB scores by 0.94 points (99% CI, 0.22–1.66), and higher (i.e., worse) NPI scores by 1.27 points (99% CI, 0.68–1.95) than patients with LOAD (table 2). Presence of an ε4 allele was associated with lower MMSE scores by 1.29 points (99% CI, 0.30–2.28), higher FAQ scores by 2.24 points (99% CI, 0.66–3.82), higher CDR-SOB scores by 0.91 points (99% CI, 0.21–1.55), and higher NPI scores by 0.68 points (99% CI, 0.07–1.28). GDS scores did not differ by age at onset or APOE genotype. There was no age at onset × APOE genotype interaction effect for any of these measures. This pattern of results did not change at the final evaluation, except that NPI scores no longer differed by APOE genotype (table 3).
Table 2.
Clinical Assessment and History at Baseline
Table 3.
Clinical Assessment at Last Visit
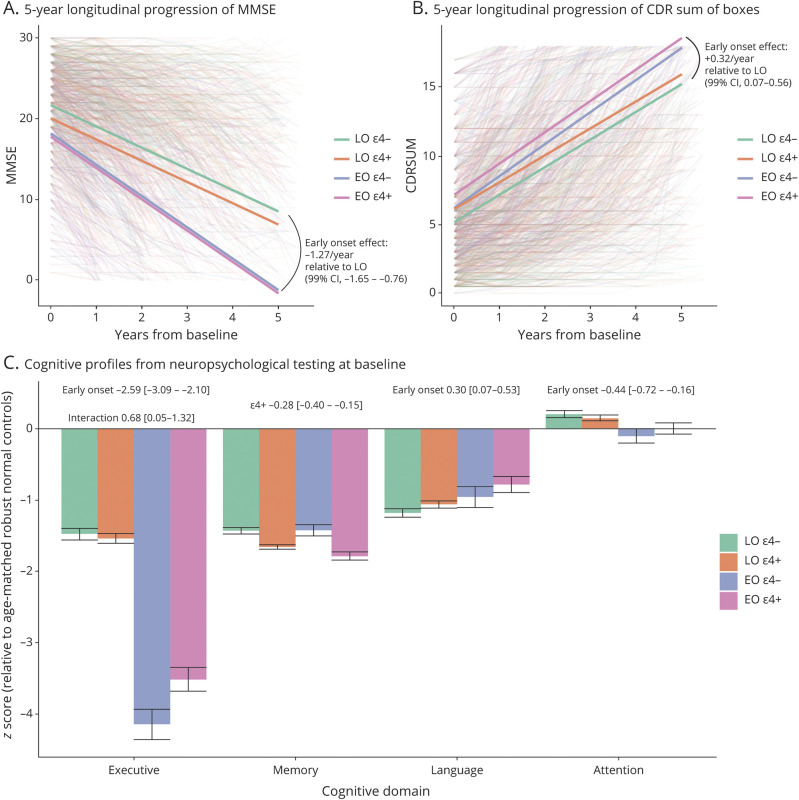
Patients with EOAD progressed more rapidly than patients with LOAD by approximately 1.27 points per year (99% CI, 0.65–1.76) on the MMSE and by 0.32 points per year (99% CI, 0.07–0.56) (higher scores are worse) on the CDR-SOB, even after accounting for differences in baseline performance (figure 3, B and C). APOE genotype or its interaction with age at onset had no significant effect on MMSE and CDR-SOB rate of decline.
Figure 3. Objective Cognitive Assessment and Progression.
(A, B) Five-year longitudinal progression on the Mini-Mental State Examination (MMSE) and Clinical Dementia Rating (CDR) sum of boxes scales from baseline, modeled with linear mixed effects models. The effect of age at onset on the longitudinal slope of decline is reported; the effect of APOE and its interaction with age at onset were not significant. (C) Baseline cognitive performance by age at onset and APOE genotype in 4 domains derived via Principal Component Analysis from the full National Alzheimer's Coordinating Center (NACC) neuropsychological battery. Performance is expressed as Z scores relative to separate age- and sex-matched robust normal control participants (those who remained normal for all NACC visits) for early onset (EO) and late onset (LO) groups. Effects for EO rather than LO, for the presence of an ε4 allele, and for their interaction are presented above the bars when significant. CI = confidence interval.
Medical History and Medication Use
Baseline reports of neurologic conditions that could affect cognition were infrequent, but history of stroke (OR, 0.20; 99% CI, 0.06–0.49) or TIA (OR, 0.34; 99% CI, 0.13–0.74) was less often reported for patients with EOAD than patients with LOAD, while history of traumatic brain injury (TBI) was more often reported for patients with EOAD than patients with LOAD (OR, 2.04; 99% CI, 1.34–3.07) (table 2). Baseline reports of psychiatric history of depression in the past 2 years were more frequent in ε4− than ε4+ cases in EOAD, but more frequent in ε4+ than ε4− cases in LOAD (p < 0.01 for the age at onset × APOE genotype interaction). Depression for more than 2 years was more common in EOAD than LOAD (OR, 1.71; 99% CI, 1.19–2.43), while alcohol abuse and other psychiatric disorders did not differ by group.
Use of antidepressants was more common at baseline in patients with EOAD than patients with LOAD (OR, 2.11; 99% CI, 1.58–2.83) (table 2). Neither anxiolytics/sedatives/hypnotics as a group nor antipsychotics differed by age at onset or APOE genotype at baseline. Use of Food and Drug Administration–approved medications for the treatment of AD was more common in patients with EOAD than patients with LOAD (OR, 1.92; 99% CI, 1.39–2.69), and in ε4+ than ε4− cases (OR, 1.72; 99% CI, 1.32–2.25), with no evidence for an interaction.
Cognitive Testing
APOE ε4+ patients had significantly worse baseline memory domain scores than ε4− patients (β = −0.28; 99% CI, −0.40 to −0.15) (figure 3A). Executive domain scores were profoundly more impaired in patients with EOAD than patients with LOAD, and this was particularly true for those with an ε4− genotype (p < 0.01 for the age at onset × APOE genotype interaction). Language domain scores were worse in patients with LOAD than patients with EOAD (β = 0.30; 99% CI, 0.07–0.53). Attention domain scores were unimpaired overall, but slightly worse in patients with EOAD than patients with LOAD (β = −0.44; 99% CI, −0.72 to −0.16).
Clinical Diagnosis
The proportion of patients diagnosed with dementia at baseline ranged from 73% to 91% across groups (table 2). Patients with EOAD were more likely than patients with LOAD to receive a clinical diagnosis of dementia rather than MCI (OR, 3.02, 99% CI, 1.94–4.90). This same pattern of results was observed at the final evaluation before death, although the proportion of cases diagnosed with dementia increased in all groups and ranged from 92% to 100% (table 3).
Presumed Etiology
The presumed etiology of the cognitive impairment was assigned based on the results of the baseline evaluation. The proportion of cases with an etiology thought to be primary or contributing to the cognitive impairment are shown as a function of age at onset and APOE genotype in figure 2C. Approximately 80%–90% of all cases were presumed to have AD pathology as primary or contributing to the cognitive impairment. In approximately 10%–20% of cases, cognitive impairment was incorrectly attributed to an etiology other than AD. Patients with EOAD were more likely than patients with LOAD (OR, 0.64; 99% CI, 0.43–0.97) to have their cognitive impairment incorrectly attributed to non-AD pathology. FTLD pathology was the second most common presumed etiology after AD and was more likely to be assigned as primary or contributing to the cognitive impairment in patients with EOAD than patients with LOAD (OR, 4.25; 99% CI, 2.74–6.65). Vascular pathology, in contrast, was less likely to be assigned to patients with EOAD than patients with LOAD (OR, 0.18; 99% CI, 0.06–0.46), although it was rarely assigned as a cause of cognitive impairment.
There was little change in the presumed etiology of cognitive impairment between the baseline and final evaluations (figure 2D). Patients with EOAD continued to be less likely than patients with LOAD to have their cognitive impairment attributed to AD, although this was now only true for ε4− patients with EOAD (p < 0.01 for the APOE genotype × age at onset interaction). FTLD remained the second most common presumed etiology after AD, and was more likely to be assigned as primary or contributing to cognitive impairment in patients with EOAD than patients with LOAD, particularly in those without an APOE ε4 allele (p < 0.01 for the APOE genotype × age at onset interaction). Vascular pathology, though rarely assigned, remained more likely to be assigned to patients with LOAD than patients with EOAD (OR, 0.25; 99% CI, 0.10–0.53).
Neuropathologic Analysis and Concomitant Pathology
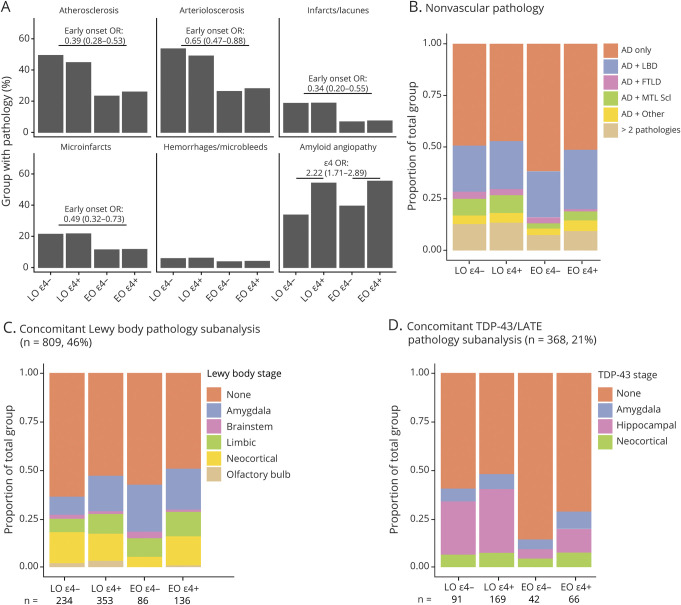
A greater percentage of ε4+ than ε4− cases had concomitant moderate to severe amyloid angiopathy (OR, 2.22; 99% CI, 1.71–2.89) (figure 4A). A lower percentage of patients with EOAD than patients with LOAD had concomitant moderate to severe atherosclerosis (OR, 0.39; 99% CI, 0.28–0.53), arteriolosclerosis (OR, 0.65; 99% CI, 0.47–0.88), infarcts/lacunae (OR, 0.34 99% CI, 0.20–0.55), and microinfarcts (OR, 0.49; 99% CI, 0.32–0.73).
Figure 4. Concomitant Pathology.
(A) Presence of each of the 6 vascular pathologies assessed is separately shown as a proportion of each APOE genotype and age at onset group. Whereas the interaction of age at onset with APOE genotype was not significant for any measures, effects of age at onset or presence of ε4 alleles separately are reported above the bars. (B) Distribution of nonvascular pathologies assessed in NACC by age at onset and APOE genotype. (C) Subanalysis of Lewy body disease (LBD) stage in cases with UDS 3 neuropathologic evaluation including all 5 categories (n = 809; 46%). (D) Subanalysis of TDP-43/LATE stage in cases with complete reported TDP-43 data in the amygdala, hippocampus, and neocortex (n = 368, 21%). AD = Alzheimer disease; EO = early onset; FTD = frontotemporal dementia; FTLD = frontotemporal lobar degeneration; LATE = limbic-predominant age-related TDP-43 encephalopathy; LO = late onset; MTL Scl = medial temporal lobe sclerosis; OR = odds ratio.
The proportion of individuals with pure severe AD with no identified concomitant pathologies was higher among patients with EOAD than patients with LOAD (OR, 1.41; 99% CI, 1.06–1.87) (figure 4B). There was no significant effect of age at onset, APOE genotype, or their interaction on the prevalence of concomitant LBD, FTLD, or other pathology. Medial temporal lobe sclerosis (including hippocampal sclerosis) was less common in patients with EOAD than in patients with LOAD (OR, 0.46; 99% CI, 0.27–0.74), but there was no significant effect of APOE genotype or age at onset × APOE genotype interaction.
In exploratory subanalyses of individuals with full staging for LBD (n = 809; 46%; figure 4C) and LATE (n = 368; 21%; figure 4D), presence of any Lewy bodies was more likely in ε4+ than ε4− patients (OR, 1.48; 99% CI, 1.02–2.17), although none of the individual stages differed by APOE genotype. Presence of any TDP-43 pathology was less likely in EOAD than LOAD (OR, 0.37; 99% CI, 0.18–0.72), driven by lower likelihood specifically of hippocampal TDP-43 (OR, 0.24; 99% CI, 0.08–0.57). The remaining effects and interactions were not significant.
Discussion
We identified several examples of age-related heterogeneity in patients with sporadic, pathologically confirmed severe AD. Consistent with previous studies of clinically diagnosed patients,8 we found that patients with EOAD were more likely than patients with LOAD to report noncognitive changes (e.g., behavioral dysfunction) or nonmemory cognitive decline (i.e., language or executive function impairment) as their initial symptom. They were also more likely to have self-reported history of TBI, but less likely to have a history of stroke or TIA. Patients with EOAD were more impaired than patients with LOAD on mental status and functional activity measures at their initial ADC evaluation. Objective cognitive testing showed that patients with EOAD had far worse executive function impairment, but less language impairment, than patients with LOAD. As in previous studies with clinically diagnosed AD,4-7 patients with EOAD declined more rapidly than patients with LOAD on cognitive and functional measures. Ultimately, patients with EOAD were more likely than patients with LOAD to receive a non-AD clinical diagnosis (e.g., FTD, DLB) at their initial ADC evaluation; however, this was only true for APOE ε4− EOAD by the last ADC evaluation.
Our results confirm in a relatively large cohort of patients with autopsy-proven severe AD greater likelihood of an initial atypical, nonmemory focal cortical presentation in EOAD than in LOAD. Despite this, patients with EOAD were more likely than patients with LOAD to have pure AD pathology without concomitant non-AD pathology. Patients with LOAD were more likely than patients with EOAD to have cerebrovascular pathology, MTL/hippocampal sclerosis, and in a subanalysis, hippocampal TDP-43, consistent with a more common history of vascular disease in LOAD than EOAD, and the known age-related increase in vascular,33,34 hippocampal sclerosis,35 and LATE27 pathology. Thus, even though patients with EOAD were more likely than patients with LOAD to have an atypical clinical presentation, concomitant non-AD pathologies were less common in EOAD than LOAD. This finding suggests that copathologies are not responsible for the atypical clinical presentation or faster cognitive decline in EOAD.
We also identified heterogeneity related to APOE genotype. Regardless of age at onset, ε4+ patients performed worse than ε4− patients on mental status and memory tests, functional activity scales, and psychiatric measures. APOE genotype was not associated with clinical diagnosis at the initial ADC evaluation, but ε4+ patients were significantly more likely than ε4− patients to be correctly assigned an AD diagnosis at their final evaluation. This increased accuracy may be because ε4+ patients exhibited a more AD-like profile with more prominent memory impairment. It is possible, however, that patients known to be ε4+ were more likely to be called AD since some ADCs may use genetic information when assigning diagnoses. There was no difference in the likelihood of concomitant pathologies in ε4+ and ε4− patients, except for a higher likelihood of amyloid angiopathy in ε4+ patients as previously reported.36 It is unclear if amyloid angiopathy significantly contributes to cognitive decline.37,38 In addition, in a subanalysis, LBD pathology (not specific to any particular LBD stage) was more likely in ε4+ than ε4− patients, consistent with findings that the APOE ε4 allele is associated with LBD pathology independent of AD.39
Frequency distributions of age at onset were different for APOE ε4+ and ε4− patients. Estimated age at onset appeared to be normally distributed for those with 1 or 2 ε4 alleles, with an expected shift toward younger onset in those with 2 ε4 alleles.40,41 In contrast, the frequency distribution of age at onset for those who were ε4− appeared to have 2 separate peaks at 57 and 76 years of age. This finding is consistent with the possibility that ε4− patients with EOAD represent a subgroup that has increased likelihood of atypical clinical features.2,3 This possibility is supported by several age at onset by APOE genotype interaction effects we observed. For example, the EOAD ε4− group was more likely than other groups to have noncognitive or nonmemory cognitive presenting symptoms, greater executive function deficits on objective testing, and were most likely to be clinically assigned an etiology other than AD (particularly FTD). By the last evaluation before death, only 76% of ε4− patients with EOAD, but over 90% of ε4+ patients with EOAD and ε4+ and ε4− patients with LOAD, were assigned an etiology of AD.
There are several possible explanations for why patients with EOAD, and especially those who are APOE ε4−, have an increased likelihood of an atypical clinical profile even in the absence of concomitant pathology. First, there may be genetic contributions to the clinical manifestation of EOAD beyond APOE in the form of polygenic risk or unknown mutations. A genetic explanation is unlikely, however, since the EOAD ε4− group had the lowest percentage (at 51%) of individuals reporting a first-degree family member with dementia.
Second, the EOAD ε4− group was more likely (at 50% prevalence) than other groups to report a history of depression within the past 2 years. Although active depression was not evident on the GDS, past depression may have influenced the nature of the initial presentation of symptoms, leading to increased reports of initial behavioral or nonmemory cognitive changes and more prominent executive function deficits in ε4− patients with EOAD. It is not clear whether depression in the past 2 years is a component of the dementia syndrome in EOAD or a reaction to awareness of cognitive impairment at a young age. However, if it is a reaction, it might be expected to equally affect ε4+ and ε4− patients with EOAD.
Third, there could be age-related differences in concomitant pathologies not fully examined or reported in the ADC neuropathologic evaluations. Indeed, our exploratory subanalysis showed associations of TDP-43 pathology with older age at onset, consistent with the criteria for LATE27 and with a recent neuropathologic cluster analysis of TDP-43 cases in the NACC dataset showing that of 2 clusters with severe concomitant AD, the cluster with more extensive TDP-43 had older ages at onset and death.42
Finally, distribution of AD pathology may differ by age at onset and APOE genotype. Previous research shows that there can be an atypical distribution of tangle pathology with neocortical predominance and hippocampal sparing even in those with severe AD pathology (i.e., Braak stage V–VI).20,43 While these studies did not specifically address age at onset, they found that this atypical distribution was most likely to occur in younger patients (< 65 on average) who were ε4−. Similarly, structural imaging and tau PET both support the idea of greater frontal and parietal atrophy and pathologic burden in EOAD.44-46 The distribution of AD pathology (beyond Braak staging) was not examined in the UDS neuropathologic evaluation so we cannot determine whether patients (particularly ε4−) with EOAD were more likely than patients with LOAD to have hippocampal sparing or some other atypical topography of AD pathology.
Several limitations of the study should be noted. The multicenter nature of the study may enhance generalizability, but it introduces variability, because the 33 contributing ADCs may differ slightly in inclusion/exclusion criteria, assessment measures used to reach a diagnosis, and neuropathologic methodology. ADC cohorts are not representative of the general population, with overrepresentation of rare dementias (e.g., FTD) and possible underrepresentation of vascular dementia. The original NACC neuropathologic evaluation did not include updated methods (e.g., α-synuclein antibodies) and diagnostic classifications (e.g., LATE), so only exploratory analysis could be carried out in some instances. Finally, our cohort was intentionally limited to those with severe AD pathology, which may have precluded our ability to observe subtle contributions of concomitant pathology to atypical disease presentations. However, applying strict pathologic criteria for AD allowed us to avoid the pitfalls of including non-AD mimics (e.g., hippocampal sclerosis47,48), while also providing a more accurate picture than clinical studies that may underestimate heterogeneity because patients with atypical presentations of AD have been misdiagnosed and excluded.
Acknowledgment
The authors thank the patients and their families who participated in the research that contributed to the NACC database.
Glossary
- AD
Alzheimer disease
- ADC
Alzheimer's Disease Center
- CBD
corticobasal degeneration
- CDR
Clinical Dementia Rating
- CDR-SOB
Clinical Dementia Rating sum of boxes
- CI
confidence interval
- EOAD
early-onset Alzheimer disease
- FAQ
Functional Assessment Questionnaire
- FTD
frontotemporal dementia
- FTLD
frontotemporal lobar degeneration
- GDS
Geriatric Depression Scale
- LATE
limbic-predominant age-related TDP-43 encephalopathy
- LBD
Lewy body disease
- LOAD
late-onset Alzheimer disease
- MCI
mild cognitive impairment
- MMSE
Mini-Mental State Examination
- MTL
medial temporal lobe
- NACC
National Alzheimer's Coordinating Center
- NPI
Neuropsychiatric Inventory
- OR
odds ratio
- PPA
primary progressive aphasia
- PSP
progressive supranuclear palsy
- TBI
traumatic brain injury
- UDS
National Alzheimer's Coordinating Center Uniform Data Set
Appendix. Authors
Footnotes
CME Course: NPub.org/cmelist
Study Funding
Study funded by NIH P30AG062429 and F30AG063440, and the D.H. Chen Foundation. The NACC database is funded by NIA/NIH grant U01 AG016976. NACC data are contributed by the NIA-funded ADCs: P30 AG019610 (PI Eric Reiman, MD), P30 AG013846 (PI Neil Kowall, MD), P30 AG062428-01 (PI James Leverenz, MD), P50 AG008702 (PI Scott Small, MD), P50 AG025688 (PI Allan Levey, MD, PhD), P50 AG047266 (PI Todd Golde, MD, PhD), P30 AG010133 (PI Andrew Saykin, PsyD), P50 AG005146 (PI Marilyn Albert, PhD), P30 AG062421-01 (PI Bradley Hyman, MD, PhD), P30 AG062422-01 (PI Ronald Petersen, MD, PhD), P50 AG005138 (PI Mary Sano, PhD), P30 AG008051 (PI Thomas Wisniewski, MD), P30 AG013854 (PI Robert Vassar, PhD), P30 AG008017 (PI Jeffrey Kaye, MD), P30 AG010161 (PI David Bennett, MD), P50 AG047366 (PI Victor Henderson, MD, MS), P30 AG010129 (PI Charles DeCarli, MD), P50 AG016573 (PI Frank LaFerla, PhD), P30 AG062429-01(PI James Brewer, MD, PhD), P50 AG023501 (PI Bruce Miller, MD), P30 AG035982 (PI Russell Swerdlow, MD), P30 AG028383 (PI Linda Van Eldik, PhD), P30 AG053760 (PI Henry Paulson, MD, PhD), P30 AG010124 (PI John Trojanowski, MD, PhD), P50 AG005133 (PI Oscar Lopez, MD), P50 AG005142 (PI Helena Chui, MD), P30 AG012300 (PI Roger Rosenberg, MD), P30 AG049638 (PI Suzanne Craft, PhD), P50 AG005136 (PI Thomas Grabowski, MD), P30 AG062715-01 (PI Sanjay Asthana, MD, FRCP), P50 AG005681 (PI John Morris, MD), and P50 AG047270 (PI Stephen Strittmatter, MD, PhD).
Disclosure
D.S. Smirnov reports no disclosures D. Galasko is a consultant for Biogen, vTv Therapeutics, Cognition Therapeutics, Fujirebio, Amprion, and Generian. A. Hiniker reports no disclosures S.D. Edland serves on Alzheimer clinical trial Data Safety Monitoring Boards for Eli Lilly and Johnson & Johnson. D.P. Salmon is a consultant for Takeda Pharmaceuticals, Inc., Aptinyx, Inc., and Biogen. Go to Neurology.org/N for full disclosures.
References
- 1.Katzman R. The prevalence and malignancy of Alzheimer disease: a major killer. Arch Neurol 1976;33:217–218. [DOI] [PubMed] [Google Scholar]
- 2.van der Flier WM, Pijnenburg YA, Fox NC, Scheltens P. Early-onset versus late-onset Alzheimer's disease: the case of the missing APOE ɛ4 allele. Lancet Neurol 2011;10:280–288. [DOI] [PubMed] [Google Scholar]
- 3.Mendez MF. Early-onset Alzheimer disease. Neurol Clin 2017;35:263–281. [DOI] [PMC free article] [PubMed] [Google Scholar]
- 4.Jacobs D, Sano M, Marder K, et al. Age at onset of Alzheimer's disease: relation to pattern of cognitive dysfunction and rate of decline. Neurology 1994;44:1215–1220. [DOI] [PubMed] [Google Scholar]
- 5.Huff FJ, Growdon JH, Corkin S, Rosen TJ. Age at onset and rate of progression of Alzheimer's disease. J Am Geriatr Soc 1987;35:27–30. [DOI] [PubMed] [Google Scholar]
- 6.Wattmo C, Wallin ÅK. Early- versus late-onset Alzheimer's disease in clinical practice: cognitive and global outcomes over 3 years. Alzheimers Res Ther 2017;9:70. [DOI] [PMC free article] [PubMed] [Google Scholar]
- 7.Barnes J, Bartlett JW, Wolk DA, van der Flier WM, Frost C. Disease course varies according to age and symptom length in Alzheimer's disease. J Alzheimers Dis 2018;64:631–642. [DOI] [PMC free article] [PubMed] [Google Scholar]
- 8.Barnes J, Dickerson BC, Frost C, Jiskoot LC, Wolk D, Flier WM. Alzheimer's disease first symptoms are age dependent: evidence from the NACC dataset. Alzheimers Dement 2015;11:1349–1357. [DOI] [PMC free article] [PubMed] [Google Scholar]
- 9.Koedam ELGE, Lauffer V, van der FlierVlies AE, van der Flier WM, Scheltens P, Pijnenburg YAL. Early-versus late-onset Alzheimer's disease: more than age alone. J Alzheimers Dis 2010;19:1401–1408. [DOI] [PubMed] [Google Scholar]
- 10.Rossor MN, Fox NC, Mummery CJ, Schott JM, Warren JD. The diagnosis of young-onset dementia. Lancet Neurol 2010;9:793–806. [DOI] [PMC free article] [PubMed] [Google Scholar]
- 11.Mendez MF, Lee AS, Joshi A, Shapira JS. Nonamnestic presentations of early-onset Alzheimer's disease. Am J Alzheimers Dis Other Demen 2012;27:413–420. [DOI] [PMC free article] [PubMed] [Google Scholar]
- 12.Gorno-Tempini ML, Brambati SM, Ginex V, et al. The logopenic/phonological variant of primary progressive aphasia. Neurology 2008;71:1227–1234. [DOI] [PMC free article] [PubMed] [Google Scholar]
- 13.Crutch SJ, Lehmann M, Schott JM, Rabinovici GD, Rossor MN, Fox NC. Posterior cortical atrophy. Lancet Neurol 2012;11:170–178. [DOI] [PMC free article] [PubMed] [Google Scholar]
- 14.Crutch SJ, Schott JM, Rabinovici GD, et al. Consensus classification of posterior cortical atrophy. Alzheimers Dement 2017;13:870–884. [DOI] [PMC free article] [PubMed] [Google Scholar]
- 15.Alladi S, Xuereb J, Bak T, et al. Focal cortical presentations of Alzheimer's disease. Brain 2007;130:2636–2645. [DOI] [PubMed] [Google Scholar]
- 16.Tang-Wai DF, Graff-Radford NR, Boeve BF, et al. Clinical, genetic, and neuropathologic characteristics of posterior cortical atrophy. Neurology 2004;63:1168–1174. [DOI] [PubMed] [Google Scholar]
- 17.Johnson JK, Head E, Kim R, Starr A, Cotman CW. Clinical and pathological evidence for a frontal variant of Alzheimer disease. Arch Neurol 1999;56:1233–1239. [DOI] [PubMed] [Google Scholar]
- 18.Ossenkoppele R, Pijnenburg YAL, Perry DC, et al. The behavioural/dysexecutive variant of Alzheimer's disease: clinical, neuroimaging and pathological features. Brain 2015;138:2732–2749. [DOI] [PMC free article] [PubMed] [Google Scholar]
- 19.Townley RA, Graff-Radford J, Mantyh WG, et al. Progressive dysexecutive syndrome due to Alzheimer's disease: a description of 55 cases and comparison to other phenotypes. Brain Commun 2020;2:fcaa068. [DOI] [PMC free article] [PubMed] [Google Scholar]
- 20.Murray ME, Graff-Radford NR, Ross OA, Petersen RC, Duara R, Dickson DW. Neuropathologically defined subtypes of Alzheimer's disease with distinct clinical characteristics: a retrospective study. Lancet Neurol 2011;10:785–796. [DOI] [PMC free article] [PubMed] [Google Scholar]
- 21.Schott JM, Crutch SJ, Carrasquillo MM, et al. Genetic risk factors for the posterior cortical atrophy variant of Alzheimer's disease. Alzheimers Dement 2016;12:862–871. [DOI] [PMC free article] [PubMed] [Google Scholar]
- 22.Beekly DL, Ramos EM, Lee WW, et al. The National Alzheimer's coordinating Center (NACC) database: the Uniform Data Set. Alzheimers Dis Assoc Dis 2007;21:249–258. [DOI] [PubMed] [Google Scholar]
- 23.Beekly DL, Ramos EM, van Belle G, et al. The National Alzheimer's Coordinating Center (NACC) database: an Alzheimer disease database. Alzheimer Dis Assoc Disord 2004;18:270–277. [PubMed] [Google Scholar]
- 24.The National Institute on Aging and Reagan Institute Working Group on diagnostic criteria for the neuropathological assessment of Alzheimer's disease. Consensus recommendations for the postmortem diagnosis of Alzheimer's disease. Neurobiol Aging 1997;18:S1–S2. [PubMed] [Google Scholar]
- 25.Joshi A, Ringman JM, Lee AS, Juarez KO, Mendez MF. Comparison of clinical characteristics between familial and non-familial early onset Alzheimer's disease. J Neurol 2012;259:2182–2188. [DOI] [PMC free article] [PubMed] [Google Scholar]
- 26.Besser LM, Kukull WA, Teylan MA, et al. The revised National Alzheimer's Coordinating Center's Neuropathology form: available data and new analyses. J Neuropathol Exp Neurol 2018;77:717–726. [DOI] [PMC free article] [PubMed] [Google Scholar]
- 27.Nelson PT, Dickson DW, Trojanowski JQ, et al. Limbic-predominant age-related TDP-43 encephalopathy (LATE): consensus working group report. Brain 2019;142:1503–1527. [DOI] [PMC free article] [PubMed] [Google Scholar]
- 28.Morris JC, Weintraub S, Chui HC, et al. The Uniform Data Set (UDS): clinical and cognitive variables and descriptive data from Alzheimer’s Disease Centers. Alzheimers Dis Assoc Dis 2006;20:210–216. [DOI] [PubMed] [Google Scholar]
- 29.Weintraub S, Salmon D, Mercaldo N, et al. The Alzheimer's Disease Centers' Uniform Data Set (UDS). Alzheimers Dis Assoc Dis 2009;23:91–101. [DOI] [PMC free article] [PubMed] [Google Scholar]
- 30.Benaglia T, Chauveau D, Hunter DR, Young D. mixtools: an R package for analyzing finite mixture models. J Stat Softw 2009;32. [Google Scholar]
- 31.Ho DE, Imai K, King G, Stuart EA. MatchIt: nonparametric preprocessing for parametric causal inference. J Stat Softw 2011;42. [Google Scholar]
- 32.Josse J, Husson F. missMDA: a package for handling missing values in multivariate data analysis. J Stat Softw 2016;70. [Google Scholar]
- 33.Conner SC, Pase MP, Carneiro H, et al. Mid-life and late-life vascular risk factor burden and neuropathology in old age. Ann Clin Transl Neur 2019;6:2403–2412. [DOI] [PMC free article] [PubMed] [Google Scholar]
- 34.Hébert R, Brayne C. Epidemiology of vascular dementia. Neuroepidemiology 1995;14:240–257. [DOI] [PubMed] [Google Scholar]
- 35.Nelson PT, Smith CD, Abner EL, et al. Hippocampal sclerosis of aging, a prevalent and high-morbidity brain disease. Acta Neuropathol 2013;126:161–177. [DOI] [PMC free article] [PubMed] [Google Scholar]
- 36.Nelson PT, Pious NM, Jicha GA, et al. APOE-ε2 and APOE-ε4 correlate with increased amyloid accumulation in cerebral vasculature. J Neuropathol Exp Neurol 2013;72:708–715. [DOI] [PMC free article] [PubMed] [Google Scholar]
- 37.Boyle PA, Yu L, Nag S, et al. Cerebral amyloid angiopathy and cognitive outcomes in community-based older persons. Neurology 2015;85:1930–1936. [DOI] [PMC free article] [PubMed] [Google Scholar]
- 38.Planton M, Raposo N, Albucher JF, Pariente J. Cerebral amyloid angiopathy-related cognitive impairment: the search for a specific neuropsychological pattern. Rev Neurol 2017;173:562–565. [DOI] [PubMed] [Google Scholar]
- 39.Dickson DW, Heckman MG, Murray ME, et al. APOE ε4 is associated with severity of Lewy body pathology independent of Alzheimer pathology. Neurology 2018;91:e1182–e1195. [DOI] [PMC free article] [PubMed] [Google Scholar]
- 40.Corder E, Saunders A, Strittmatter W, et al. Gene dose of apolipoprotein E type 4 allele and the risk of Alzheimer's disease in late onset families. Science 1993;261:921–923. [DOI] [PubMed] [Google Scholar]
- 41.van der Lee SJ, Wolters FJ, Ikram MK, et al. The effect of APOE and other common genetic variants on the onset of Alzheimer's disease and dementia: a community-based cohort study. Lancet Neurol 2018;17:434–444. [DOI] [PubMed] [Google Scholar]
- 42.Katsumata Y, Abner EL, Karanth S, et al. Distinct clinicopathologic clusters of persons with TDP-43 proteinopathy. Acta Neuropathol 2020;140:659–674. [DOI] [PMC free article] [PubMed] [Google Scholar]
- 43.Petersen C, Nolan AL, de Paula França Resende E, et al. Alzheimer's disease clinical variants show distinct regional patterns of neurofibrillary tangle accumulation. Acta Neuropathol 2019;138:597–612. [DOI] [PMC free article] [PubMed] [Google Scholar]
- 44.Fiford CM, Ridgway GR, Cash DM, et al. Patterns of progressive atrophy vary with age in Alzheimer's disease patients. Neurobiol Aging 2018;63:22–32. [DOI] [PMC free article] [PubMed] [Google Scholar]
- 45.Sluimer JD, Vrenken H, Blankenstein MA, et al. Whole-brain atrophy rate in Alzheimer disease. Neurology 2008;70:1836–1841. [DOI] [PubMed] [Google Scholar]
- 46.Schöll M, Ossenkoppele R, Strandberg O, et al. Distinct 18F-AV-1451 tau PET retention patterns in early- and late-onset Alzheimer's disease. Brain 2017;140:2286–2294. [DOI] [PubMed] [Google Scholar]
- 47.Brenowitz WD, Monsell SE, Schmitt FA, Kukull WA, Nelson PT. Hippocampal sclerosis of aging is a key Alzheimer's disease mimic: clinical-pathologic correlations and comparisons with both Alzheimer’s disease and non-tauopathic frontotemporal lobar degeneration. J Alzheimers Dis 2014;39:691–702. [DOI] [PMC free article] [PubMed] [Google Scholar]
- 48.Smirnov DS, Galasko D, Hansen LA, Edland SD, Brewer JB, Salmon DP. Trajectories of cognitive decline differ in hippocampal sclerosis and Alzheimer's disease. Neurobiol Aging 2018;75:169–177. [DOI] [PMC free article] [PubMed] [Google Scholar]
Associated Data
This section collects any data citations, data availability statements, or supplementary materials included in this article.
Data Availability Statement
NACC has developed and maintains a large relational database of standardized clinical and neuropathologic research data collected from the National Institute on Aging–funded ADCs across the United States. NACC data are freely available to all researchers at alz.washington.edu/.


