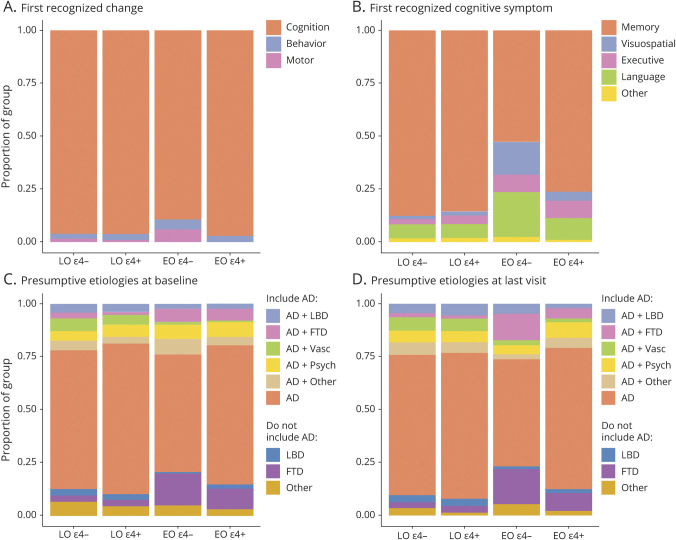
Figure 2. Clinical Presentation and Diagnosis.
(A) Proportion of patients reporting cognition, behavior, or motor impairments as the first recognized change, plotted as a function of age at onset and APOE genotype. The colors of the bars represent the proportion of which mutually exclusive outcome was reported in each group. Missing data for n = 22 (1%). (B) Distribution of which specific cognitive symptom was first recognized in the participant, plotted as a function of age at onset and APOE genotype. The “other” group includes rare reports of the first symptom being orientation (n = 1; <1%), attention/concentration (n = 23; 1%), and other write-ins (n = 8; <1%). Missing data for n = 8 (<1%). (C, D) Clinically assigned presumptive etiologies reported as either “primary” or “contributing” to the cognitive impairment at baseline and last visit (closest to death). The etiology combinations that correctly included Alzheimer disease (AD) are represented with pastel colors at the top; those that missed AD in error are in darker tones at the bottom of the figure. The “AD + other” and non-AD “other” groups include other combinations in the presence or absence of AD, respectively, that account for <5% of the total sample. Missing data for n = 109 (6%) at baseline and n = 10 (<1%) at final visit. EO = early onset; FTD = frontotemporal dementia; LBD = Lewy body disease; LO = late onset.

