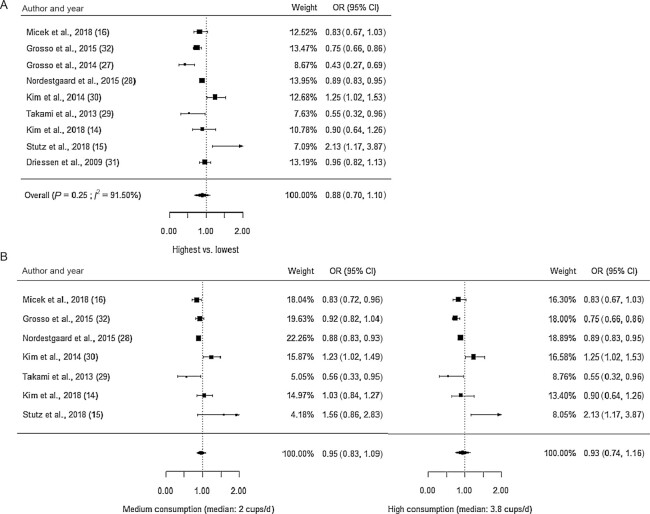
FIGURE 1.
Forest plots with effect estimates from the random-effect meta-analysis of coffee consumption and metabolic syndrome, adjusted for sex. A) The pooled ORs of the highest consumption category using data from all studies; B) the pooled ORs of the medium and high coffee consumption with data from studies with >3 consumption levels.

