
FIGURE 2.
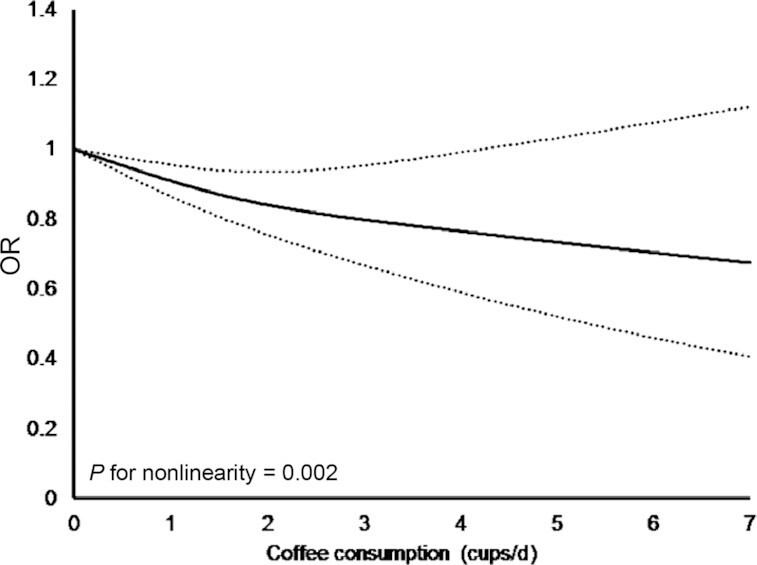
Dose-response curve from the random-effect meta-analysis of coffee consumption and metabolic syndrome, adjusted for sex. Solid line depicts estimated OR and dashed lines depict 95% CI.
Official websites use .gov
A
.gov website belongs to an official
government organization in the United States.
Secure .gov websites use HTTPS
A lock (
) or https:// means you've safely
connected to the .gov website. Share sensitive
information only on official, secure websites.
Dose-response curve from the random-effect meta-analysis of coffee consumption and metabolic syndrome, adjusted for sex. Solid line depicts estimated OR and dashed lines depict 95% CI.