FIGURE 4.

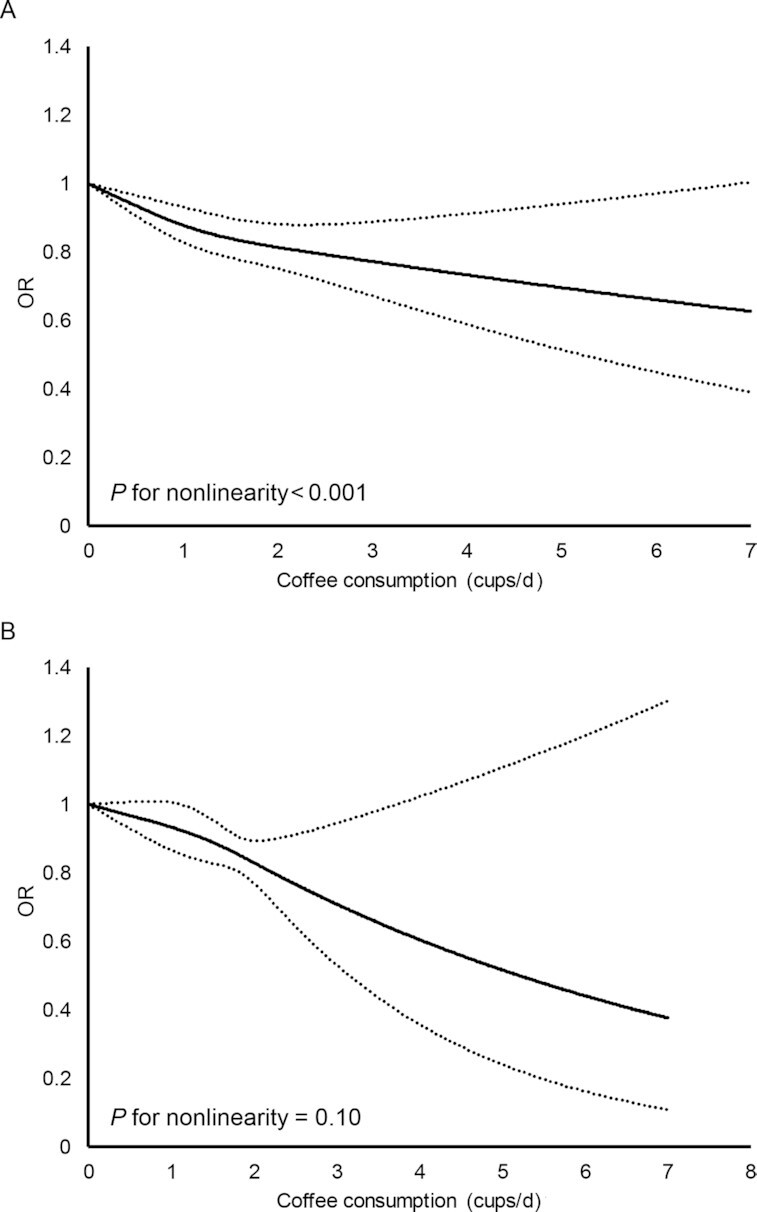
Dose-response curve from the random-effect meta-analysis of coffee consumption and metabolic syndrome in A) males and B) females. Solid lines depict estimated OR and dashed lines depict 95% CI.

Dose-response curve from the random-effect meta-analysis of coffee consumption and metabolic syndrome in A) males and B) females. Solid lines depict estimated OR and dashed lines depict 95% CI.