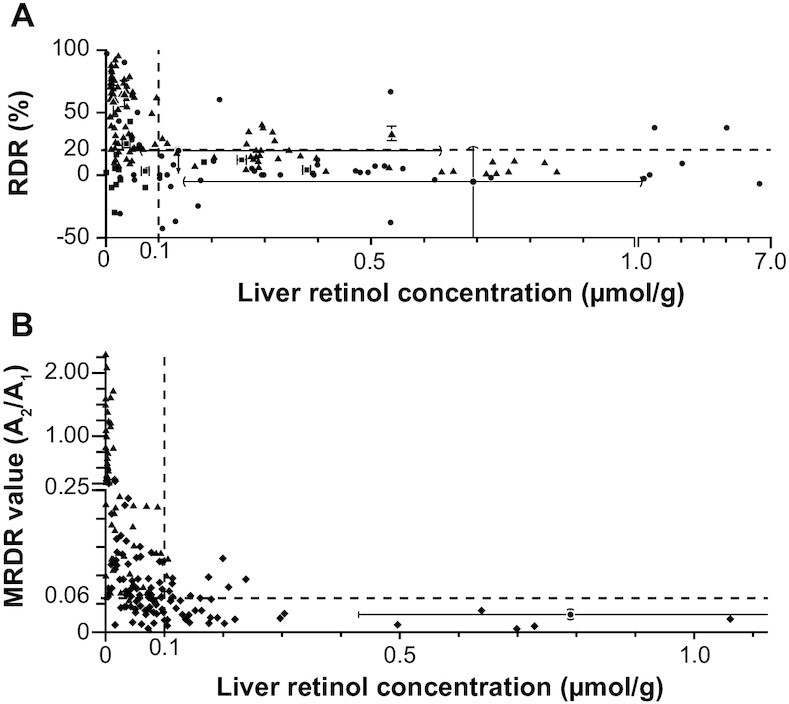
FIGURE 2.

Comparison of the RDR tests with vitamin A TLR, the gold standard for vitamin A status. See Table 1 for more details about individual studies. (A) RDR test value versus TLR. (B) MRDR test value versus TLR. In both panels, accepted cutoffs for deficiency are plotted as dashed lines at an RDR value of 20%, an MRDR value of 0.060, and TLR of 0.1 μmol vitamin A/g (1). The symbols represent individual or group values, where triangles represent rats, squares represent calves, diamonds represent swine, and circles represent humans. For studies where only a group value was available (see Table 1), the SD is plotted with flat end-caps, range is plotted with round end-caps, and an arrow is used for 1 study (126) with unknown group RDR where all points were reported to have an RDR value <20% (i.e., normal). MRDR, modified relative dose-response; RDR, relative dose-response; TLR, total liver reserves.
