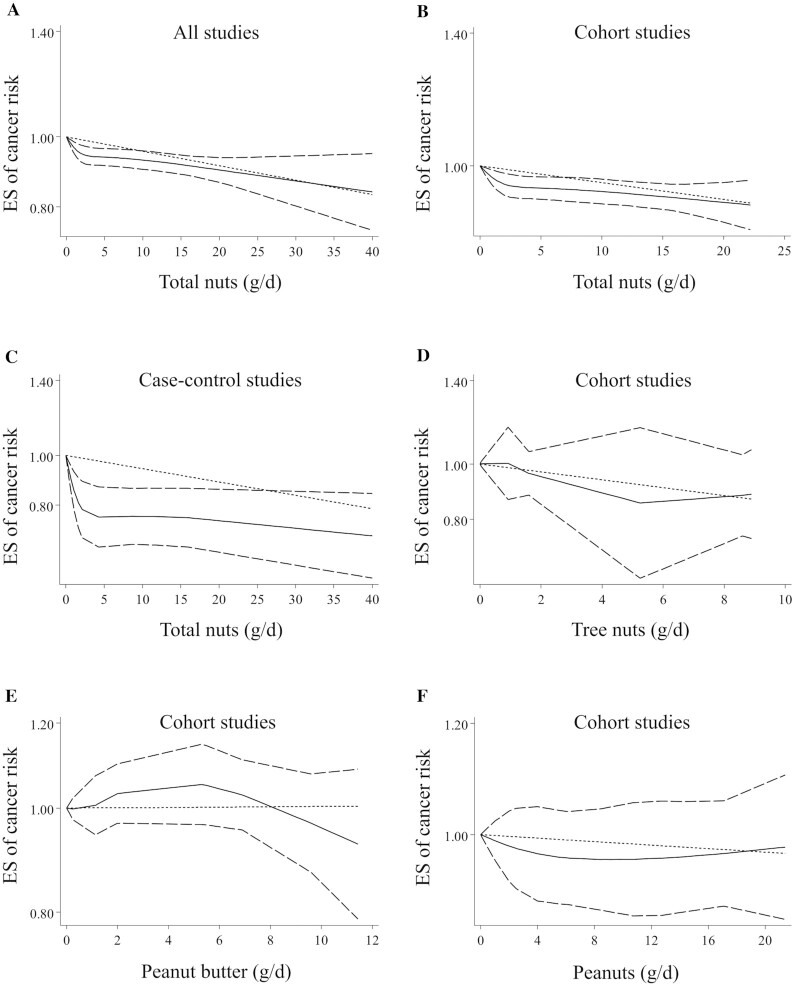
FIGURE 2.
Nonlinear dose-response associations between total nut (A, B, C), tree nut (D), peanut butter (E), and peanut (F) intake and risk of overall cancer in adults aged ≥18 y among all (A), cohort (B, D, E, F), and case-control studies (C). Dietary intake of nuts was modeled in a random-effects model using restricted cubic splines with knots fixed at the 5th, 35th, 65th, and 95th percentiles of the distribution. The dotted line indicates the linear model. The solid line represents point estimates of the association between nut intake and ESs. The dashed line presents the 95% CI. ES, effect size.

