FIGURE 1.

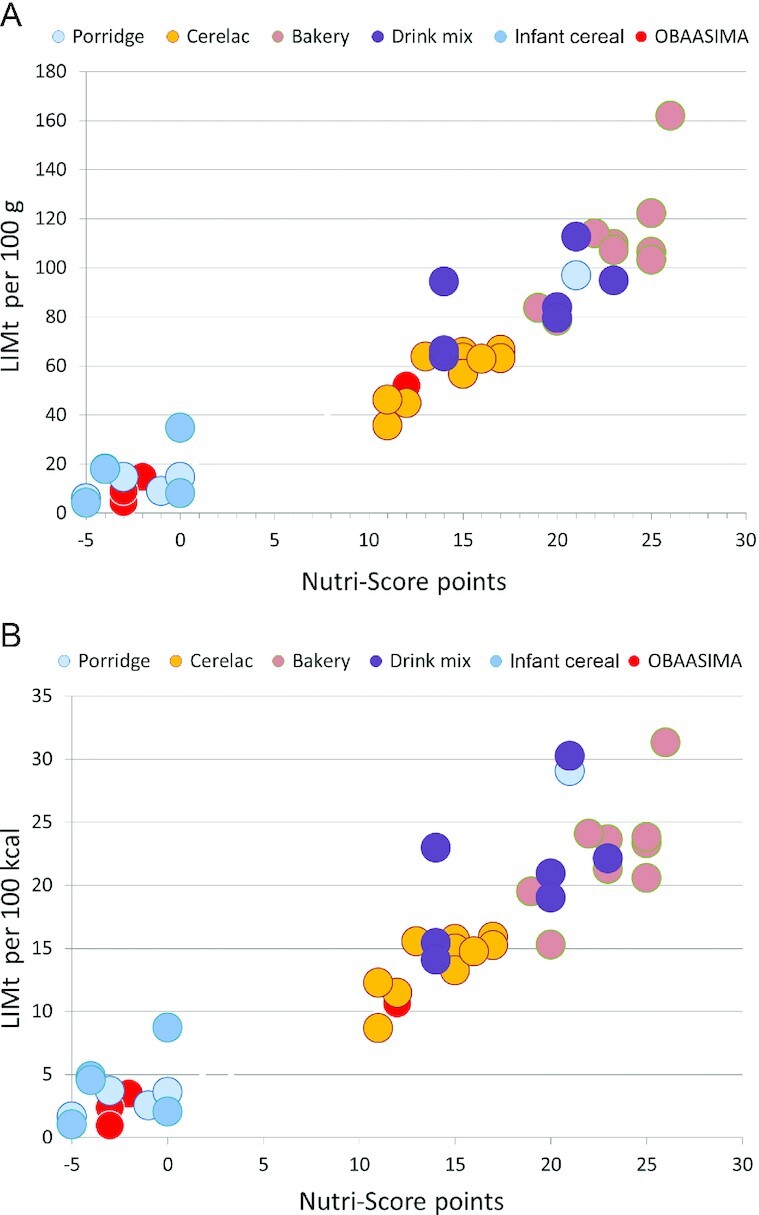
Scatterplot of Nutri-Score plotted against LIMt subscore of the Nutrient Rich Food (NRF) index by product type. LIMt per 100 g (A); LIMt per 100 kcal (B). LIMt, limiting subscore of the NRF index based on added sugar; OBAASIMA.

Scatterplot of Nutri-Score plotted against LIMt subscore of the Nutrient Rich Food (NRF) index by product type. LIMt per 100 g (A); LIMt per 100 kcal (B). LIMt, limiting subscore of the NRF index based on added sugar; OBAASIMA.