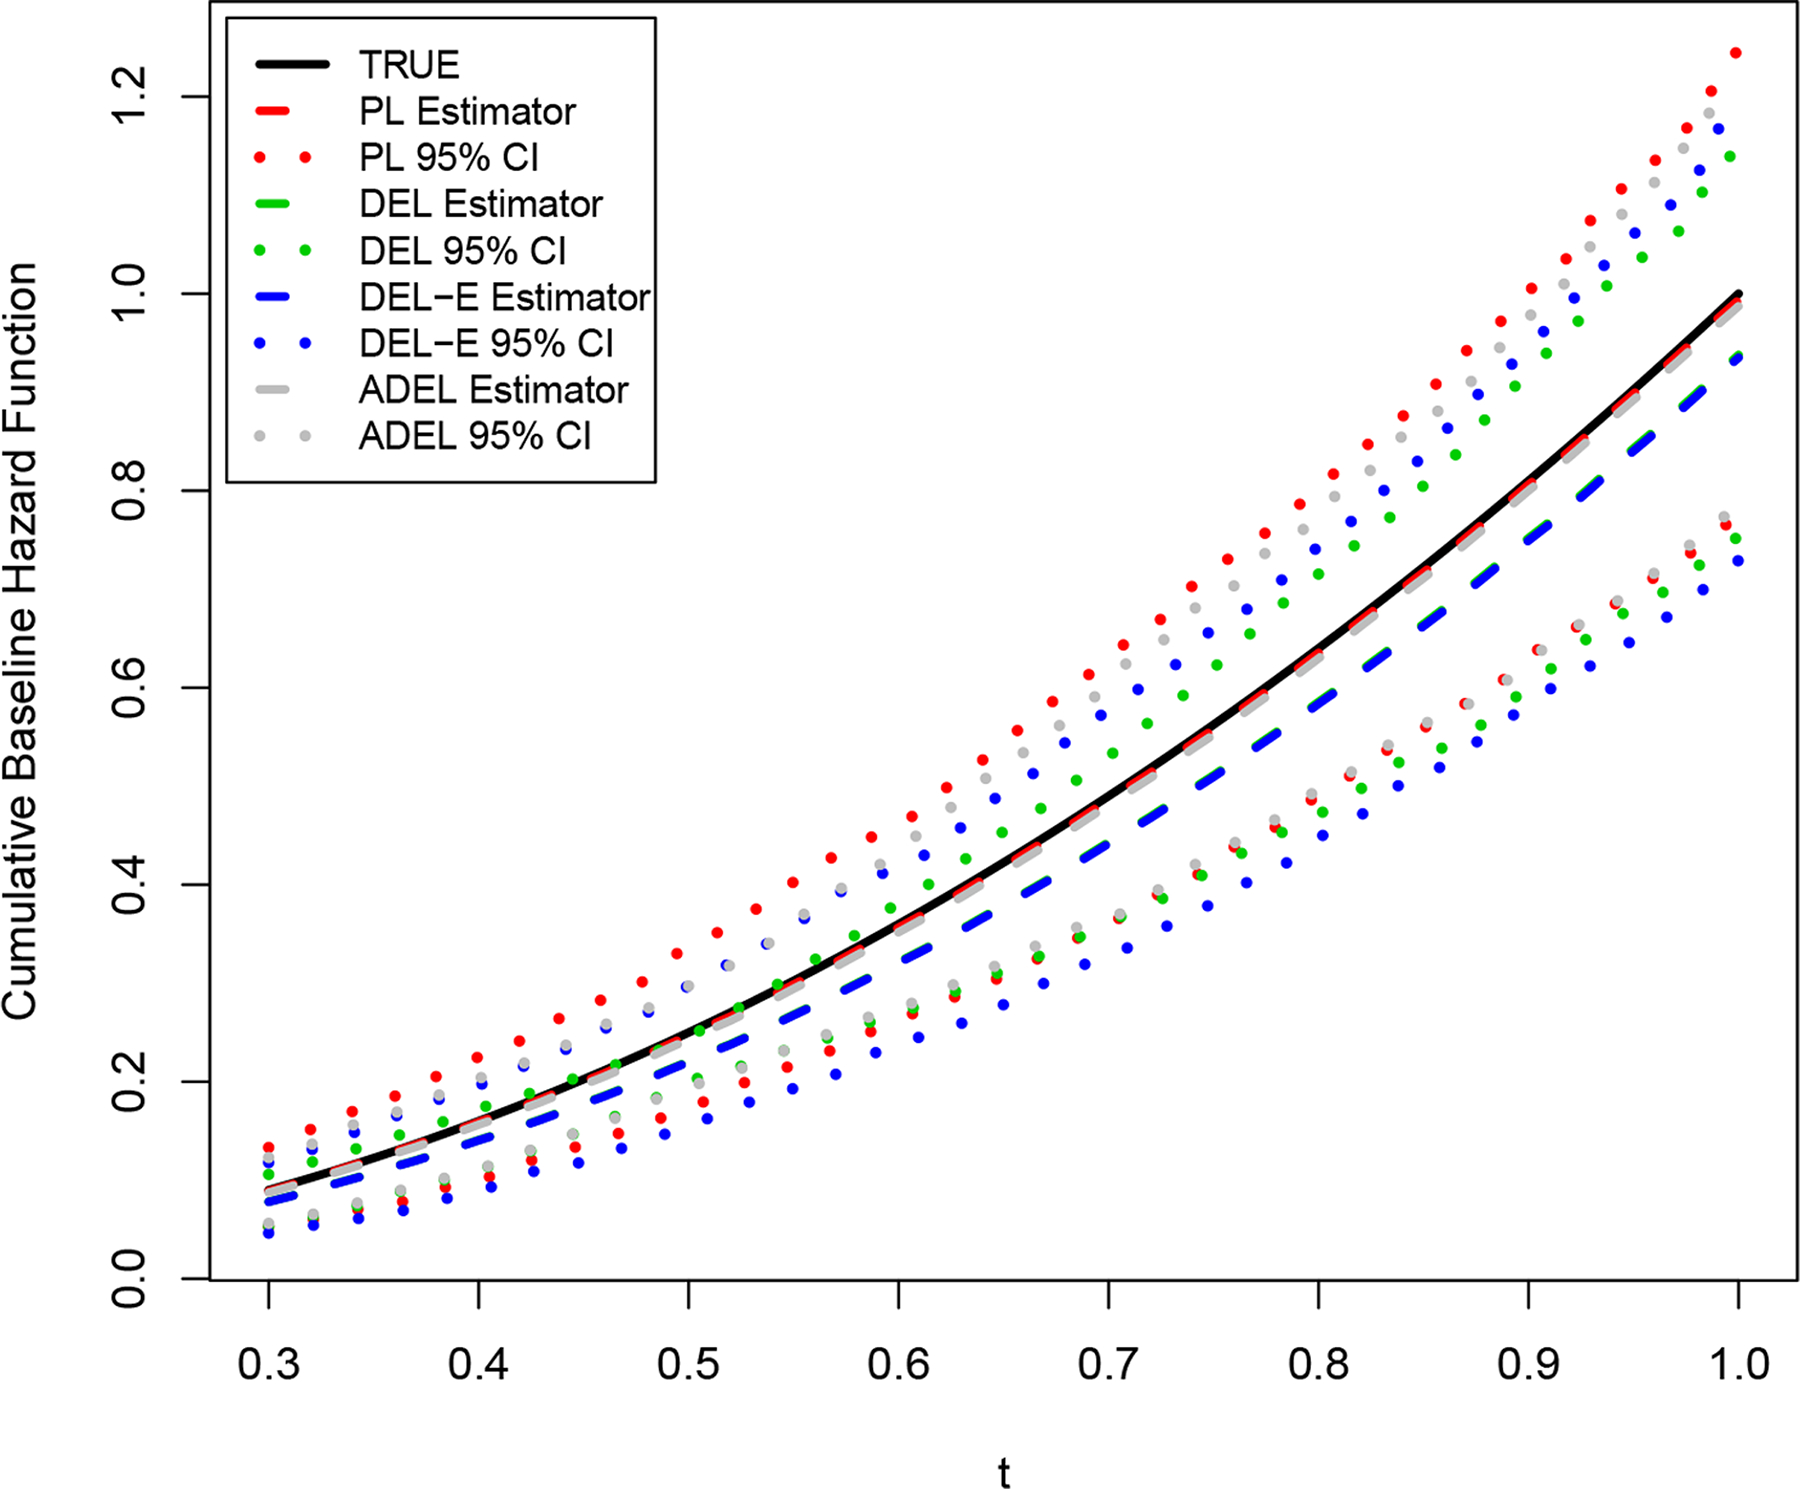
Figure 1:

Estimated cumulative baseline hazard functions under Setting 2 with a sample size of n = 200: true curve (black solid), estimated curve (gray dashed) with 95% confidence intervals (CIs) (gray dotted) by the proposed method, estimated curve (red dashed) with 95% CIs (red dotted) by PL method, estimated curve (green dashed) with 95% CIs (green dotted) by DEL method, and estimated curve (blue dashed) with 95% CIs (blue dotted) by DEL-E method.
