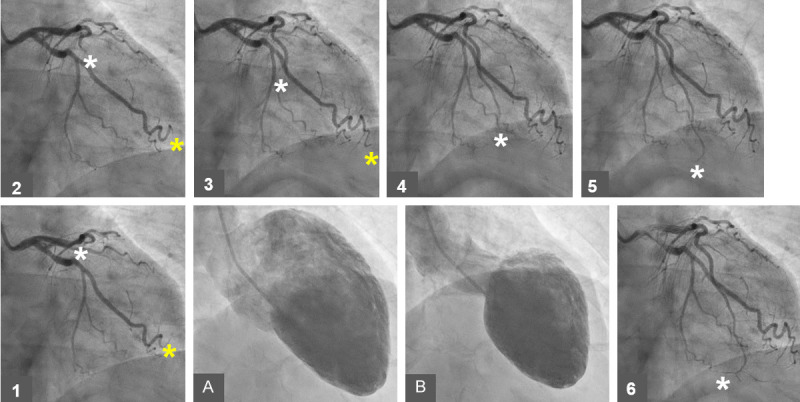
Figure 1.

A case of mid-apical ballooning pattern of TS showing the left ventricle during diastole (A) and during systole (B). A series of the left coronary angiography (LCA) from 1 to 6 showing clearly slower flow in the left anterior descending artery (LAD, white Asterix) compared to flow in the left circumflex artery (LCx, yellow Asterix). Note that the contrast has reached the end left circumflex-obtuso-marginal branch at the image number 3 (yellow Asterix 1 to 3) while the contrast has reached the middle of LAD at the image 3 (white Asterix 1 to 3) and reached the end of LAD at the image 6 (white Asterix 4 to 6).
