Figure 1.
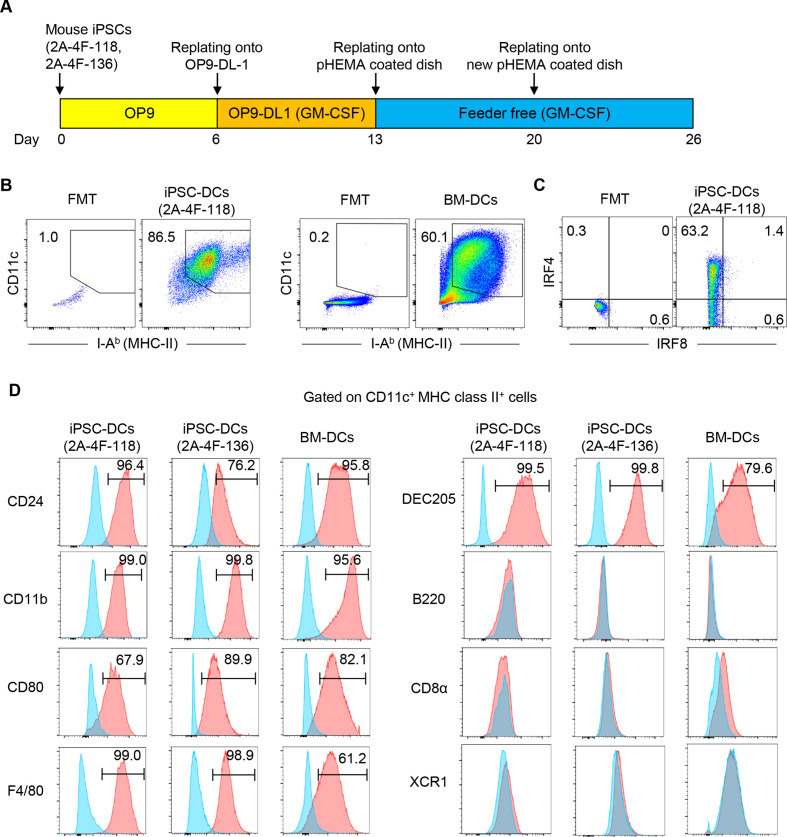
Generation of dendritic cells (DCs) from mouse induced pluripotent stem cells (iPSCs). (A) Schematic illustration showing the generation of DCs from iPSCs. (B) Phenotypic analysis of iPSC-derived cells on day 26, and bone marrow-derived cells on day 10 differentiated in the presence of GM-CSF in vitro. (C) Representative flow cytometric plots showing IRF4 and IRF8 expression of CD11c+ MHC class II+ iPSC-derived DCs (iPSC-DCs). (D) Phenotypic analysis of CD11c+ MHC class II+ cells. Representative histogram showing CD24, DEC205, CD80, CD11b, B220, CD8α, XCR1 and F4/80 expressions on CD11c+ MHC class II+ 2A-4F-118 iPSC-DCs, 2A-4F-136 iPSC-DCs and bone marrow-derived DCs (BM-DCs) (red). Isotype-matched controls are shown in blue. Number denotes per cent positive cells for each marker. Data shown are representative of three independent experiments. FMT, fluorescence minus two; GM-CSF, granulocyte macrophage colony-stimulating factor; IRF4/8, interferon regulatory factor-4 and 8; MHC, Major Histocompatibility Complex; OP9-DL-1, OP9 cells expressing a notch ligand, delta-like-1; pHEMA, poly 2-hydroxyethyl methacrylate.

