Figure 4.
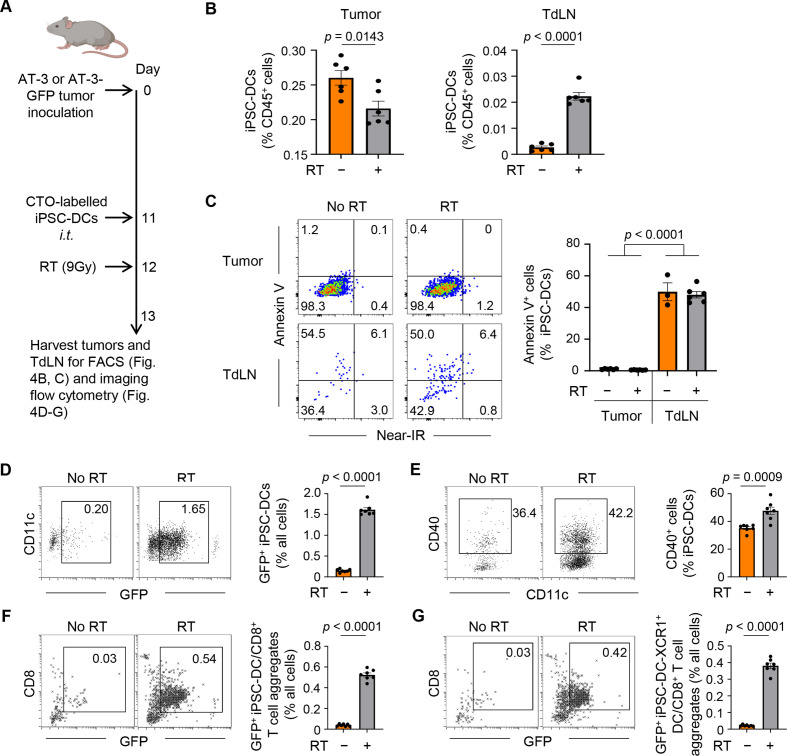
RT augments trafficking of intratumorally injected iPSC-DCs to the TdLN, upregulates CD40 expression, and increases the frequency of DC/CD8+ T cell aggregates. (A) Experimental set-up. Mice bearing AT-3 or AT-3-GFP tumors had an intratumoral iPSC-DC injection with or without local RT (9 Gy). Gating strategy for identifying fluorescently (CTO: CellTracker Orange)-labeled iPSC-DCs by flow cytometry and imaging flow cytometry is shown in online supplemental figure 4 and online supplemental figure 5, respectively. FACS, fluorescence-activated cell sorting. (B) Frequency of iPSC-DCs in the tumor and TdLN in different treatment groups as indicated (n=6). (C) Representative flow cytometric plots showing annexin V and near-IR expression of iPSC-DCs in the tumor and TdLN. The data panel shows the frequency of annexin V+ iPSC-DCs in the tumor and TdLN (n=3–6). Data with total iPSC-DCs >10 from the experiment (B) were evaluated. (D–G) Representative dot plots and frequencies of GFP+ iPSC-DCs as single cells or engaged in cell aggregates (D), CD40+ CD11c+ cells in iPSC-DCs (E), GFP+ iPSC-DC in direct contact with CD8+ T-cell (F), and GFP+ iPSC-DC-XCR1+ DC in direct contact with CD8+ T-cell (G) analyzed by imaging flow cytometry. Representative images are shown in online supplemental figure 6. Each dot represents biologically independent mice (B–G). One-way ANOVA with Tukey’s multiple comparisons (C) and two-tailed unpaired t-test (B, D–G). Mean±SEM. ANOVA, analysis of variance; GFP, green fluorescent protein; iPSC-DCs, induced pluripotent stem cell-derived dendritic cells; IR, infrared; i.t., intratumorally; RT, radiotherapy; TdLN, tumor-draining lymph node.

