
Fig. 2.
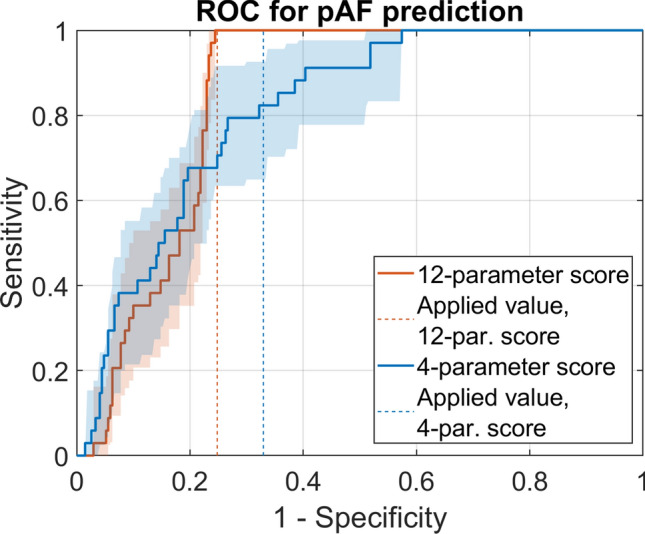
Performance of predictive scores for classification between pAF and SR. ROC curves were calculated for pAF prediction scores containing 12 parameters or 4 parameters (areas: 95% confidence intervals estimated by bootstrapping). Dashed lines indicate specificity values (75% for 12-parameter score, 67% for 4-parameter score) and sensitivity values (100% for 12-parameter score, and 82% for 4-parameter score) obtained by the pre-defined score thresholds