Fig. 4.

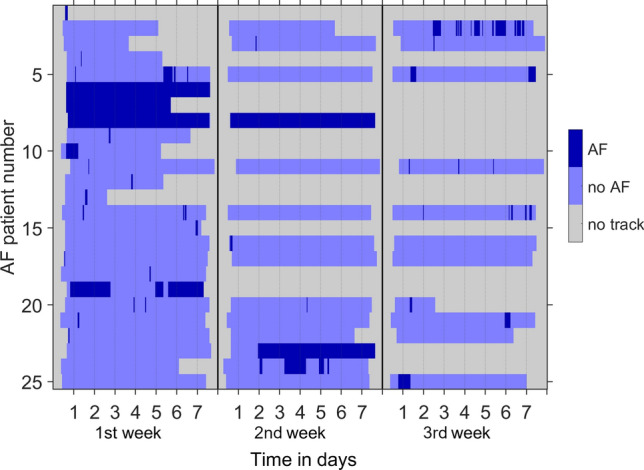
Temporal profiles of AF episodes. In 25 of a total of 34 patients with AF, up to 3 weeks of time-resolved ECG data were available (y-axis). Episodes are indicated by dark blue colour in ECG traces displayed parallel to the x-axis

Temporal profiles of AF episodes. In 25 of a total of 34 patients with AF, up to 3 weeks of time-resolved ECG data were available (y-axis). Episodes are indicated by dark blue colour in ECG traces displayed parallel to the x-axis