
Fig. 2.
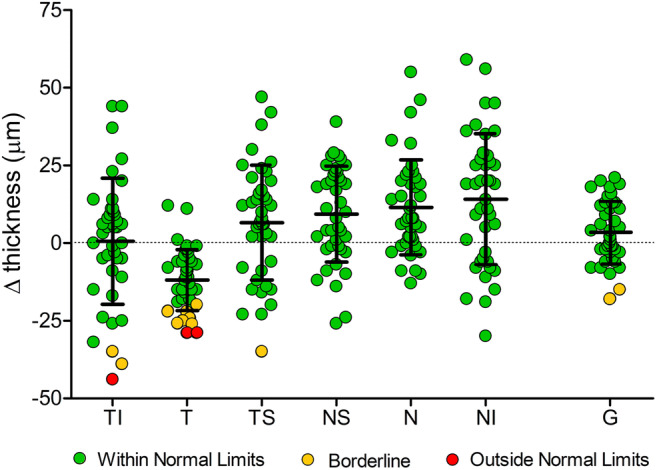
Peripapillary RNFL thickness in Stargardt disease. Differences in peripapillary RNFL thickness (Δ thickness) compared to age-corrected, normative data provided by the manufacturer (Heidelberg Engineering) of each sector are illustrated. “Within normal limits” (green plots) is defined as the area above the 5th percentile of the RNFL thickness distribution in eyes in the reference database, “borderline” (yellow plots) as the area below the 5th percentile, but above the 1st percentile, and “outside normal limits” (red plots) as the area below the 1st percentile. Mean and standard deviation are shown