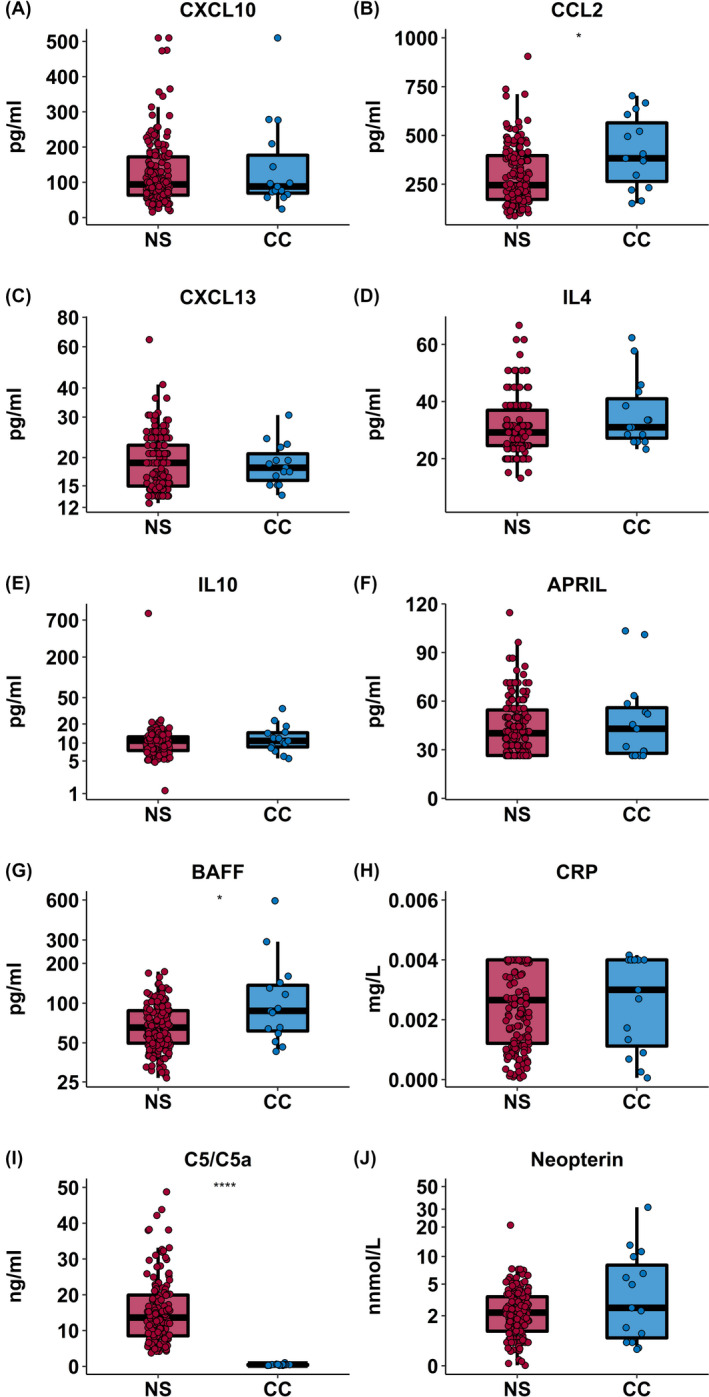
FIGURE 3.

Cerebral spinal fluid inflammatory markers in patients with nodding syndrome. Box plots showing CSF levels of markers of immune activation in cases of nodding syndrome (NS, n = 154, red) compared with CSF controls (CC, n = 15, blue). Box plots represent median and IQR with whiskers denoting the 5% and 95% percentiles data compared using the Mann‐Whitney U test, where *P ≤ .01, **P ≤ .001, ***P ≤ .0001, and ****P ≤ .00001. After adjusting for multiple for multiple comparisons, only C5/C5a remained significant
