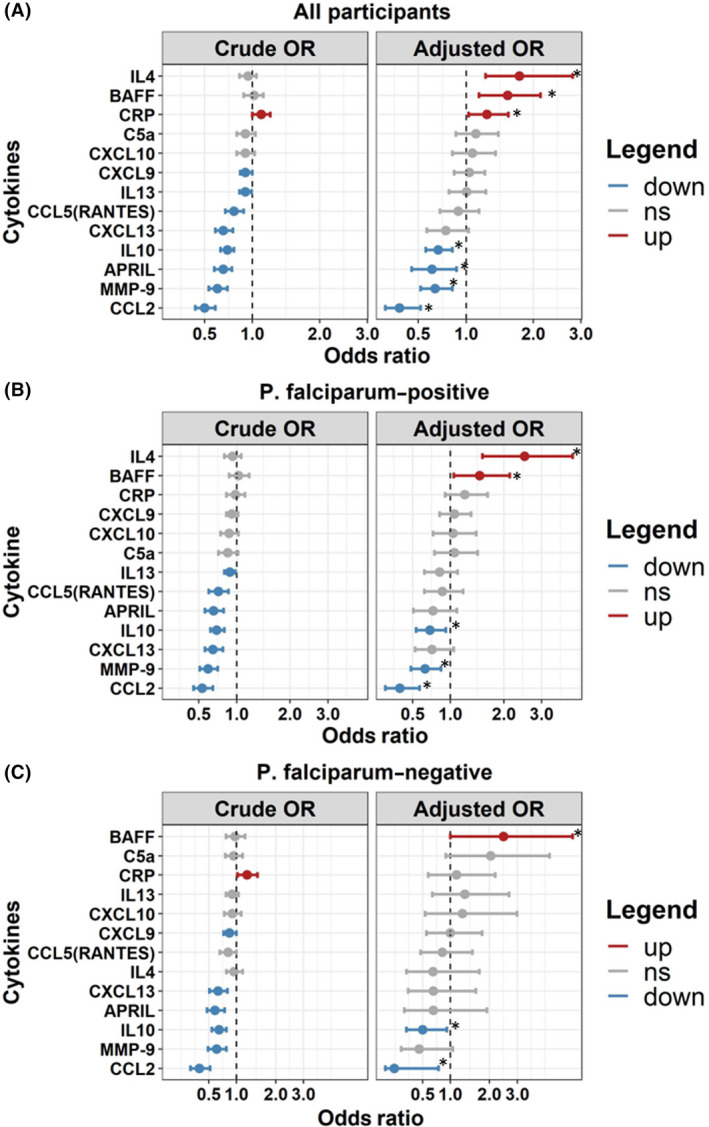
FIGURE 4.

Forest plot depicting the relationship between plasma markers of inflammation in children with nodding syndrome and community children. Forest plots show odds ratio (95% CI) from a multivariable logistic regression model based on a one‐unit change in log 10‐transformed plasma biomarker with nodding syndrome cases as the dependent variable. (A) Model with all participants (NS = 154 and CC = 154). (B) Model in P falciparum–positive individuals (NS = 112, CC = 84). (C) Model in P falciparum–negative participants (NS = 42, CC = 70). Adjusted models included participant age, sex, BMI‐for‐age z score, O volvulus seropositivity, and P falciparum status (in combined model). Plasma markers upregulated in nodding syndrome are shown in red, markers with no change are shown in gray, and markers downregulated are depicted in blue. Markers significant following adjustment for multiple comparisons are indicated with an asterisk. Markers are ordered by odds ratio from highest to lowest within each plot
