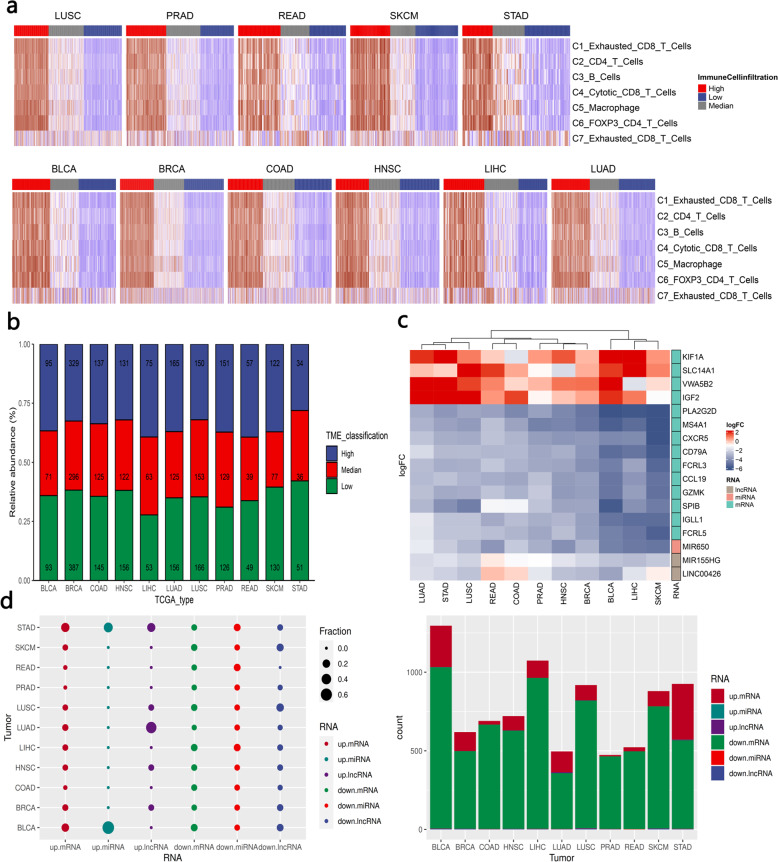
Fig. 2. Unsupervised clustering identification of the cold/hot tumor immune microenvironment.
a Heatmap for global expression (estimated with the GSVA algorithm) of immune cell markers in each TCGA tumor type. b Stacked bar plot for the proportion of immune microenvironment type in each tumor type. The number in each bar is the number of tumor samples assigned to the corresponding TME classification (high: inflamed, low: noninflamed, median: excluded). c Heatmap for the differentially expressed molecular characteristics (including mRNA, lncRNA, miRNA). The heatmap cell is colored according to the fold change of genes in differential expression analysis, where red represents genes that are upregulated in noninflamed tumors. d Overview of the molecular signature differences between inflamed and noninflamed TMEs. The fraction in the left panel represents the proportion of molecular characteristics from a tumor type among the molecular characteristics from all tumor types.

