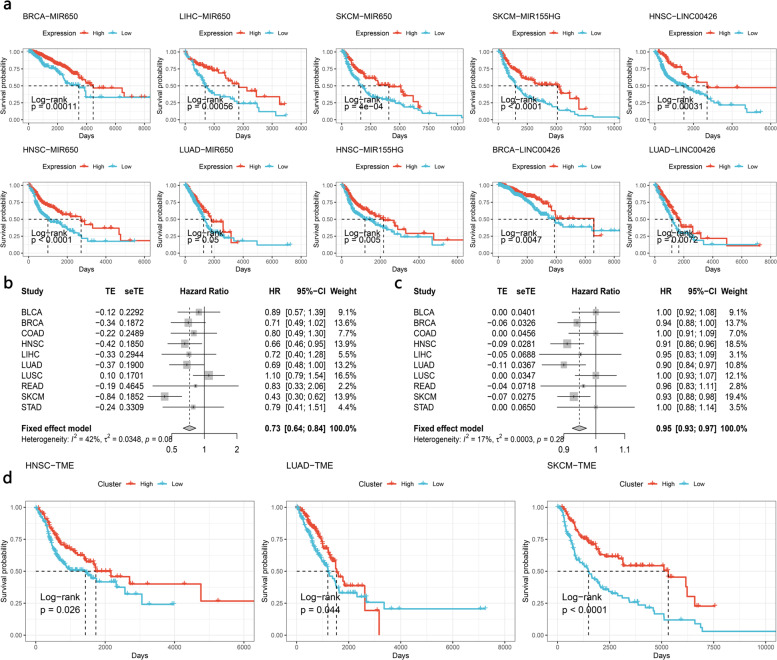
Fig. 7. Prognostic role of immunophenotypes and noncoding RNA.
a Kaplan–Meier plots show the overall survival rate for noncoding RNAs. The P value was calculated using the log-rank model. b, c Forest plots show hazard ratios for identified immunophenotypes. The hazard ratio of b was calculated by a single variable Cox model. c is from the multiple variable cox model. d Kaplan–Meier plots show the overall survival rate for the identified immunophenotypes. The P value was calculated using the log-rank model.

