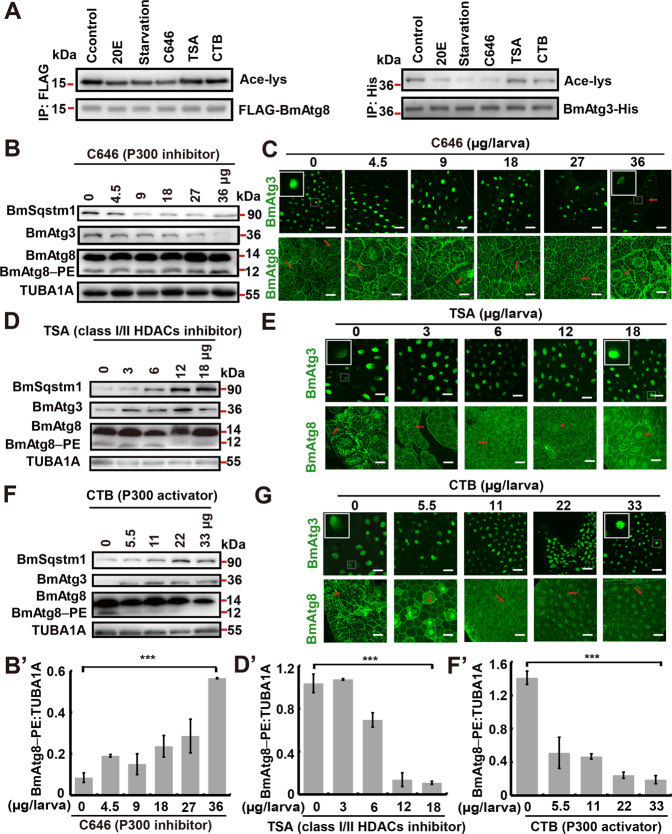
Fig. 4. P300 and class I/II HDAC activities oppositely regulate BmAtg3 and BmAtg8 nuclear localization and autophagy.
A Acetylation levels of BmAtg3-His and FLAG-BmAtg8 after 5 μM 20E, starvation, 800 nM C646, 20 µM TSA, or 20 µM CTB treatment for 6 h in BmN cells. IP immunoprecipitation. B–B′ Protein levels of BmSqstm1, BmAtg3, and BmAtg8 in the fat body after 4.5, 9, 18, 27, or 36 μg/larva C646 treatment for 24 h, 0 μg/larva treatment is used as control (B). Quantification of BmAtg8–PE in B (B′). Significance test was performed between the control and the highest dose. C Immunofluorescent staining of BmAtg3 and BmAtg8 in the fat body after 4.5, 9, 18, 27, or 36 μg/larva C646 treatment for 24 h. Arrows: typical treated cells. Scale bar: 10 µm. D–D′ Protein levels of BmSqstm1, BmAtg3, and BmAtg8 in the fat body after 3, 6, 12, or 18 μg/larva TSA treatment for 24 h (D). Quantification of BmAtg8–PE in D (D′). Significance test was performed between the control and the highest dose. E Immunofluorescent staining of BmAtg3 and BmAtg8 in the fat body after 3, 6, 12, or 18 μg/larva TSA treatment for 24 h. Scale bar: 10 µm. F–F′ Protein levels of BmAtg3, BmAtg8, and BmSqstm1 in the fat body after 5.5, 11, 22, or 33 μg/larva CTB treatment for 24 h (F). Quantification of BmAtg8–PE in F (F′). Significance test was performed between the control and the highest dose. G Immunofluorescent staining of BmAtg3 and BmAtg8 in the fat body after 5.5, 11, 22, or 33 μg/larva CTB treatment for 24 h. Scale bar: 10 µm.

