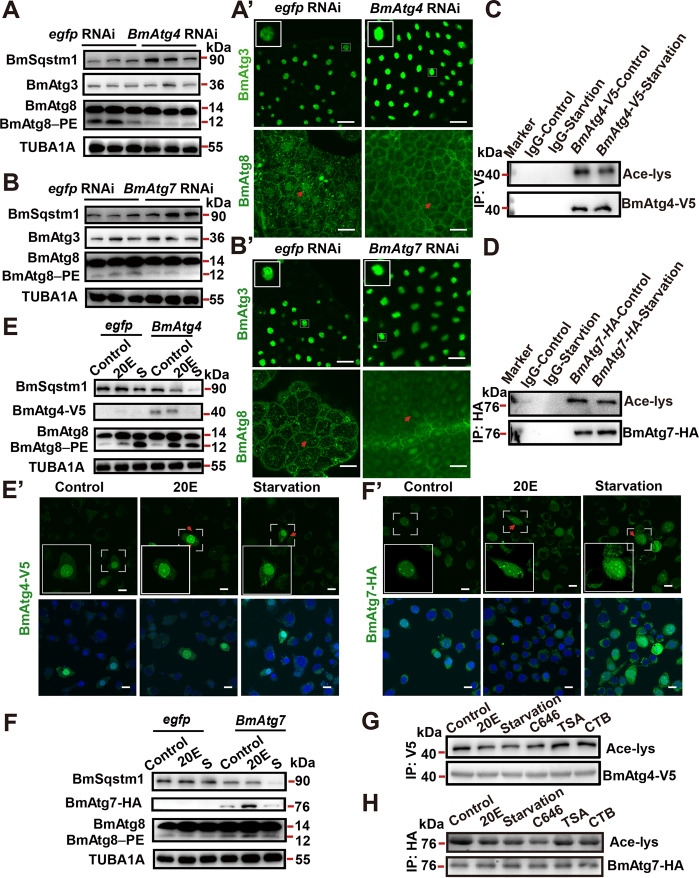
Fig. 5. Autophagic activities of BmAtg4 and BmAtg7 are accompanied by a variation of acetylation.
A–A′ Protein levels of BmSqstm1, BmAtg3, and BmAtg8 (A) and immunofluorescent staining of BmAtg3 and BmAtg8 (A’) in the fat body after BmAtg4 RNAi for 24 h. Scale bar: 10 µm. B–B′ Protein levels of BmSqstm1, BmAtg3, and BmAtg8 (B) and immunofluorescent staining of BmAtg3 and BmAtg8 (B′) in the fat body after BmAtg7 RNAi for 24 h. Scale bar: 10 µm. C Acetylation levels of BmAtg4-V5 after starvation for 4 h. D Acetylation levels of BmAtg7-HA after starvation for 4 h. E–E′ Protein levels of BmAtg8, BmSqstm1, and BmAtg4-V5 (E), and immunofluorescent staining of BmAtg4-V5 (E′) after 20E or starvation treatment for 4 h, S starvation. Scale bar: 10 µm. F–F′ Protein levels of BmSqstm1, BmAtg7-HA, and BmAtg8 (F), and immunofluorescent staining of BmAtg7-HA (F′) after 20E or starvation treatment for 4 h. Scale bar: 10 µm. G Acetylation levels of BmAtg4-V5 after 5 μM 20E, starvation, 800 nM C646, 20 µM TSA, or 20 µM CTB treatment for 6 h in BmN cells. H Acetylation levels of BmAtg7-HA after 5 μM 20E, starvation, 800 nM C646, 20 µM TSA, or 20 µM CTB treatment for 6 h in BmN cells.

