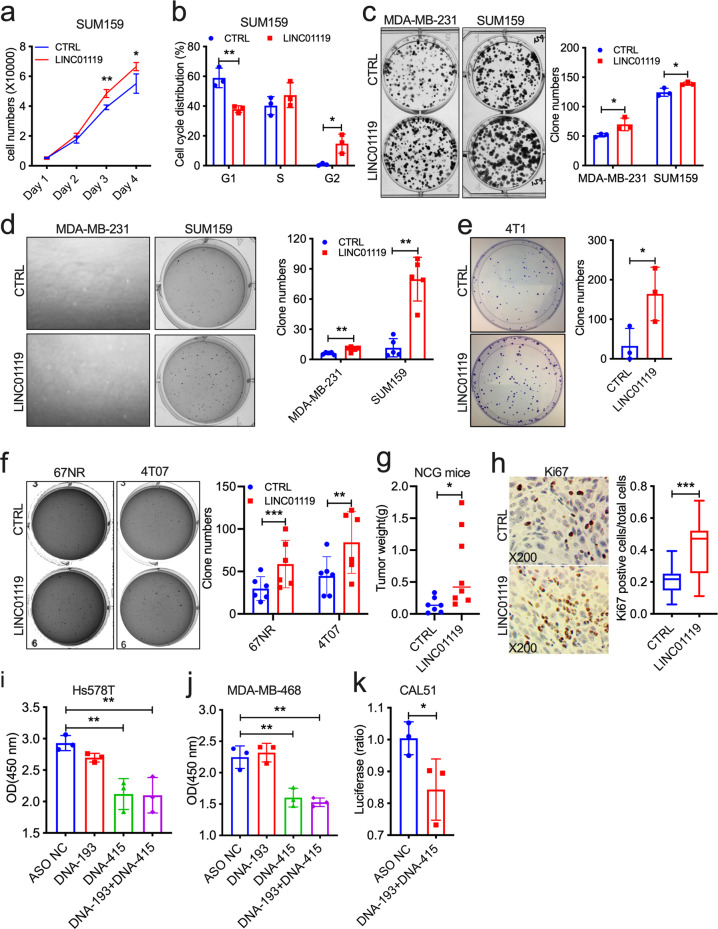
Fig. 3. LINC01119 promotes oncogenic functions.
a, b Proliferation (a) and cell cycle (b) of LINC01119-overexpressing SUM159 cells compared to controls at the indicated days (mean ± SD of n = 3). c Left: representative images of colony-formation assays on the indicated MDA-MB-231 and SUM159 groups. Right: ImageJ quantitation of colony numbers in Left displayed as mean ± SD of n = 3. d Left: representative images of 3D anchorage-independent growth of the indicated MDA-MB-231 and SUM159 cell lines. Right: ImageJ quantitation of colony numbers in Left displayed as mean ± SD of n > 3. e Left: representative images of colony-formation assays on the indicated mouse 4T1 groups. Right: ImageJ quantitation of colony numbers in Left displayed as mean ± SD of n = 3. f Left: representative images of 3D anchorage-independent growth of the indicated mouse 67NR and 4T07 cell lines. Right: ImageJ quantitation of colony numbers in Left displayed as mean ± SD of n > 3. g Weight of the indicated SUM159 tumors grown orthotopically in NCG mice after 42 days (n > 5 per group). h Left: representative images of immunohistochemistry of Ki67 in tumor tissues in g. Right: quantitation of Ki67 positive cells in Left displayed as box-and-whisker plots representing the median (centerline) and inter-quartile range (IQR; box). The whiskers extend up to 1.5 times the IQR from the box to the smallest and largest points. i, j Proliferation (mean ± SD of n = 3) of Hs578T (i) and MDA-MB-468 (j) cells transfected with controls (NC) or with LINC01119 ASOs measured using WST-1 assay after 48 h. k Proliferation (mean ± SD of n = 3) of CAL51 cells transfected with control or with a combination of LINC01119 ASOs measured using CellTiter after 48 h.

