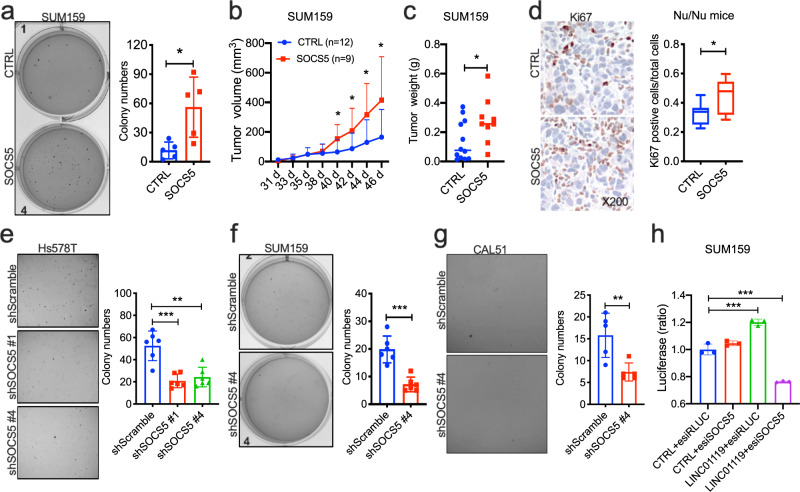
Fig. 6. Critical role for SOCS5 in TNBC cell growth.
a Left: representative images of anchorage-independent growth patterns of controls versus SUM159 cells stably expressing human SOCS5. Right: ImageJ quantitation of colony numbers in Left displayed as mean ± SD of n = 5. b Growth kinetics of indicated orthotopic tumors derived from SUM159 controls (n = 12) or SUM159 cells expressing pLVX-SOCS5 (n = 9) in Nu/Nu nude mice measured by digital calipers with mean ± SD indicated per time point. c Weight of the indicated SUM159 tumors in B with the median shown. d Left: representative images of immunohistochemistry of Ki67 in tumor tissues in c; Right: quantitation of Ki67 positive cells in Left displayed as box-and-whisker plots representing the median (centerline) and inter-quartile range (IQR; box). The whiskers extend up to 1.5 times the IQR from the box to the smallest and largest points. e Left: representative images of anchorage-independent growth patterns of Hs578T cells stably expressing sh scramble control, shSOCS5#1 and shSOCS5#4. Right: ImageJ quantitation of colony numbers in Left displayed as mean ± SD of n > 3. f Left: representative images of anchorage-independent growth patterns of controls versus SUM159 cells stably expressing SOCS5 shRNA#4. Right: ImageJ quantitation of colony numbers in Left displayed as mean ± SD of n > 3. g Left: representative images of anchorage-independent growth patterns of controls versus SOCS5 shRNA#4 in CAL51 cells. Right: ImageJ quantitation of colony numbers in Left displayed as mean ± SD of n > 3. h Proliferation (mean ± SD of n = 3) of control or LINC01119-over-expressing SUM159 cells transfected with esiRLUC or esiSOCS5 measured using CellTiter after 72 h.

