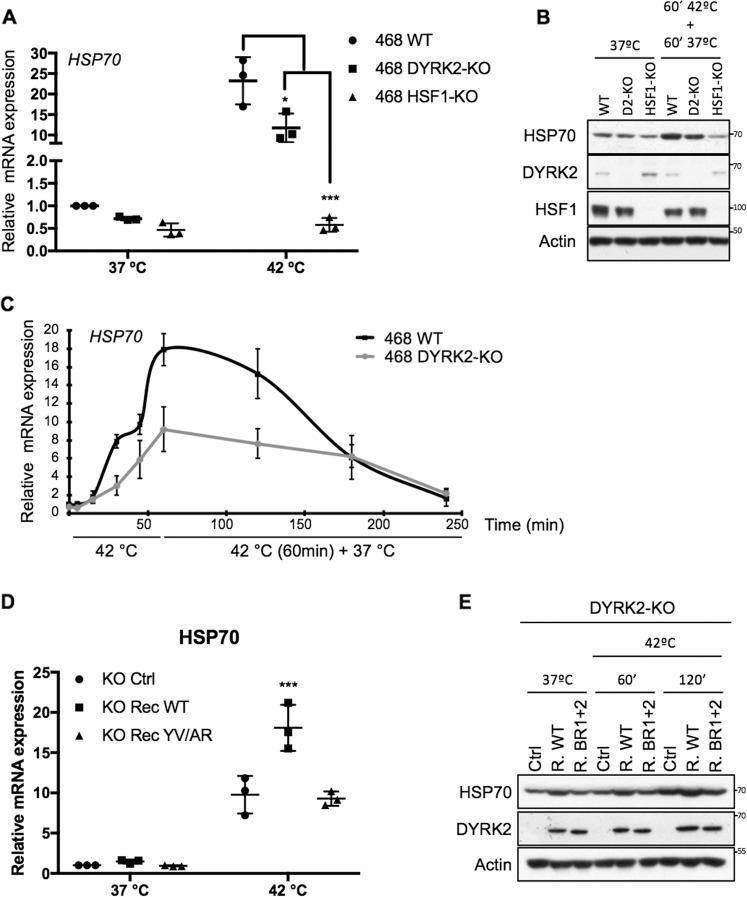
Fig. 4. DYRK2 affects the expression levels of the HSF1 target gene HSP70.
A Control (WT), DYRK2-KO or HSF1-KO MDA-MB-468 cells were incubated at 37 or 42 °C for 1 h. The mRNA levels for HSP70 (HSPA1A) were quantified using real-time PCR. The data were normalised using β-actin as an internal control. Data represent means ± SD (n = 3) and are expressed relative to the control sample levels at 37 °C. *P ≤ 0.05, **P ≤ 0.01, ***P ≤ 0.001, B Control (WT), DYRK2-KO or HSF1-KO MDA-MB-468 cells were incubated at 37 or at 42 °C for 1 h followed by another hour at 37 °C. Cells were lysed and the levels of the indicated proteins were analysed by western blot. The corresponding quantifications of HSP70 protein levels are shown in Supplementary Fig. S4B. C Control (WT) and DYRK2-KO MDA-MB-468 cells were incubated at 37 °C, at 42 °C for 5, 15, 30 or 60 min, or at 42 °C for 60 min plus recovery time at 37 °C (up to 180 min). After that, mRNA levels for HSP70 (HSPA1A) were quantified using real-time PCR. The data were normalised using β-actin as an internal control. Data represent means ± SD (n = 3) and are expressed relative to the control samples at 37 °C. D DYRK2-KO MDA-MB-468 infected with virus encoding for either empty vector (Ctrl), DYRK2-WT (R. WT) or the DYRK2 HSF1-interaction deficient mutant (R. BR1 + 2) were incubated at 37 °C or at 42 °C for 60 min. After that, mRNA levels for HSP70 (HSPA1A) were quantified using real-time PCR. The data were normalised using β-actin as an internal control. Data represent means ± SD (n = 3) and are expressed relative to the control samples at 37 °C. *P ≤ 0.05, **P ≤ 0.01, ***P ≤ 0.001. E DYRK2-KO MDA-MB-468 infected with virus encoding for either empty vector (Ctrl), DYRK2-WT (R. WT) or the DYRK2 HSF1-interaction deficient mutant (R. BR1 + 2) were incubated at 37 °C or at 42 °C for either 60 or 120 min. Cells were lysed and the levels of the indicated proteins were analysed by western blot. The corresponding quantifications of HSP70 protein levels are shown in Supplementary Fig. S4D. See also Fig. S4.

