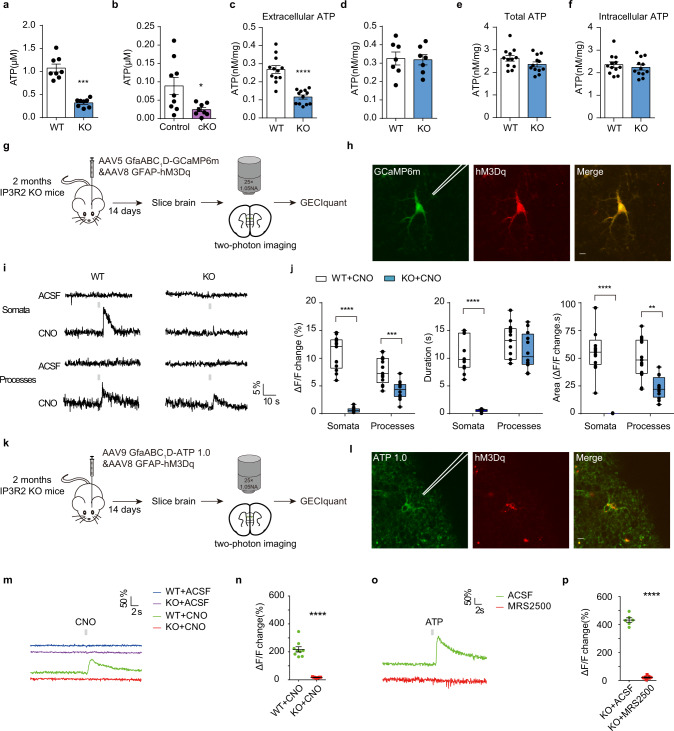
Fig. 2. Astrocytic ATP release is impaired in IP3R2 KO mice.
a, b ATP levels in the mPFC of IP3R2 KO (a U = 0, P = 0.0002, n = 8) and IP3R2 cKO (b U = 14, P = 0.0360, n = 9/8) mice. IP3R2loxp/loxp mice were used as control (b). c, d ATP levels in the culture medium of astrocytes (c, t22 = 6.397, P = 0.3 × 10⁻⁵, n = 12) or neurons (d t12 = 0.1578, P = 0.8772, n = 7) from IP3R2 KO and WT mice. e, f Total ATP levels (e t22 = 1.620, P = 0.1195, n = 12) and intracellular ATP levels (f t22 = 0.6959, P = 0.4938, n = 12) in astrocytes from IP3R2 KO and WT mice. g Schematic experimental approach. h Two-photon calcium imaging of an hM3Dq&GCaMP6m-expressing astrocyte, with an adjacently placed glass pipette. Scale bar, 5 μm. i Representative fluorescence traces from an hM3Dq&GCaMP6m-expressing astrocyte treated with CNO or ACSF in IP3R2 WT and KO mice. A gray line represents the 200 ms of 10 mM CNO application. j Summary of the results from all imaged cells (WT vs. KO, ΔF/F change, somata: t23 = 12.473, P = 0, processes: t23 = 4.271, P = 0.286 × 10⁻³; duration, somata: t23 = 11.826, P = 0, processes: t23 = 1.305, P = 0.2058; area, somata: t23 = 7.839, P = 0, processes: t23 = 3.239, P = 0.3622 × 10⁻²; n = 13/12 cells from 3 mice each). Box plots present, in ascending order, minimum sample value, first quartile, median, third quartile, and maximum sample value. k Schematic experimental approach. l Same as (h) but for an hM3Dq- and ATP1.0-expressing astrocyte. Scale bar, 5 μm. m Same as (i) but for an hM3Dq- and ATP1.0-expressing astrocyte. Representative movies are shown as Supplementary Videos 1-4. n Summary of the results from all imaged cells (t16 = 10.79, P = 0.5 × 10⁻⁵, n = 9 cells from 3 mice each). o Representative fluorescence traces from hM3Dq- and ATP1.0-expressing astrocytes pre-treated with ACSF or 30 μM MRS2500 (a P2Y1R antagonist) in IP3R2 KO mice. p Summary of the results from all imaged cells (t13 = 25.20, P = 0.1 × 10⁻⁵, n = 6/9 cells from 3 mice each). Data are presented as mean ± SEM. *P < 0.05, **P < 0.01, ***P < 0.001, ****P < 0.0001. Two-tailed unpaired t test (a–f, j, n, p). Source data are provided as a Source data file.

