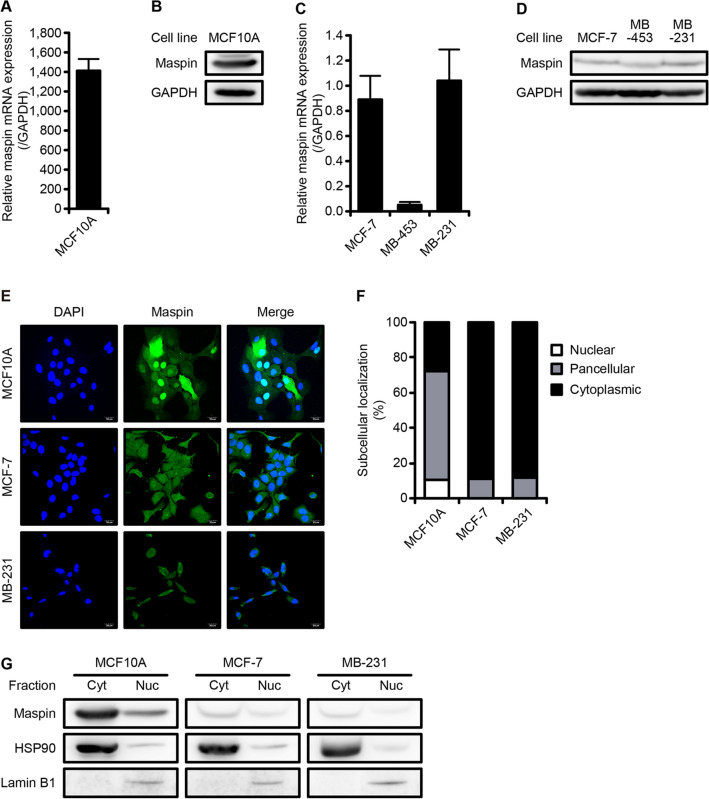
Figure 1.
Expression and subcellular localization of maspin in non-tumorigenic and tumorigenic cell lines. (A) Relative mRNA expression level of maspin in MCF10A cells. mRNA expression was normalized to level of GAPDH. Data are shown as the mean ± SD (n = 3). (B) Protein expression level of maspin in MCF10A cells. GAPDH is shown for loading control. Whole western blots are presented in Supplementary Fig. S7. (C) Relative mRNA expression levels of maspin in breast cancer cell lines. mRNA expression was normalized to levels of GAPDH. Data are shown as the mean ± SD (n = 3). (D) Protein expression levels of maspin in three breast cancer cell lines. Expression level of GAPDH was used as a protein loading control. Whole western blots are presented in Supplementary Fig. S8. (E) Representative images of subcellular localization of maspin protein in MCF10A, MCF-7, and MDA-MB-231 cells. Expression of maspin protein was detected using anti-maspin antibody (clone G167-70). Nuclei was counterstained with DAPI. Scale bars represent 20 μm. Images were acquired using Olympus FLUOVIEW FV1000D confocal laser scanning microscope and Olympus FV10-ASW software (ver. 02.01). (F) Quantification of the subcellular localization of maspin. Bar graph shows the percentage of maspin distribution that is calculated by counting number of cells exhibiting pancellular, nuclear, or cytoplasmic distribution (n = 3). (G) Protein expression of maspin in the cytoplasmic (Cyt) and nuclear (Nuc) fractions. Expression levels of HSP90 and Lamin B1 was used as protein loading control in the cytoplasmic and nuclear fractions, respectively. Whole western blots are presented in Supplementary Fig. S9.

